Web frontend performance – distilled

Web frontend performance – distilled

Web performance used to be (in the good old server-only / server-rendering days) mainly dominated by the performance of your webservers delivering the dynamic content to the browser. Well, this changed quite a lot with application-like web frontends. Their main promise is to replace these annoying request/response pauses with one longer waiting period in the beginning of the session – but then have light-speed for subsequent requests.

Here are some really good links I just discovered today – they all deal with various aspects of frontend web-performance. Let’s start.

Comparing MV* frameworks? There is a great project – named TodoMVC – that compares various frontend-frameworks – amongst them are Backbone.js, AngularJS, Ember.js, KnockoutJS, Dojo, YUI, Agility.js, Knockback.js, CanJS, Maria, Polymer, React, Mithril, Ampersand, Flight, Vue.js, MarionetteJS, Vanilla JS, jQuery and a lot more.

Performance impact comparison by the filament group. A good effort on research was spent on the topic “Research: Performance Impact of Popular JavaScript MVC Frameworks” – focusing on e.g. Angular.js, Backbone.js and Ember.js. Performance testing was done with the previous mentioned implementation of TodoMVC. The raw data is accessible as well. Most interesting are the results (measuring avg. first render time):

Mobile 3G connection on Nexus 5

  • Ember averages about 5 seconds
  • Angular averages about 4 seconds
  • Backbone averages about 1 second

PC via LAN

  • Ember averages about 1.17 seconds
  • Angular averages about 0.88 seconds
  • Backbone averages about 0.29 seconds

Practical hints to accelerate responsive designed websites. In his post “How we make RWD sites load fast as heck” Scott Jehl (@scottjehl) gives some pracitcal hints on what to focus on:

  • Page wight isn’t the only measure; focus on perceived performance
  • Shortening the critical path
  • Going async
  • Inlining code
  • Shooting for 14kb
  • Taking advantage of caches
  • Using grunt in the deploy pipe

Angular 1.x and architecture problems. Another interesting blog article by Peter-Paul Koch (@ppk) focusses explicitly on Angular. “The problem with Angular” talks about severe performance problems with Angular 1.x versions. In his blog he notes

” … Angular 2.0, which would be a radical departure from 1.x. Angular users would have to re-code their sites in order to be able to deploy the new version …”

Wow. That’s interesting and a good indication for serious architecture issues with Angular 1.x …

Thought-leading companies and performance. Good articles / blog posts from leading companies on page speed performance:

The Real Cost of Slow Time vs. Downtime – great presentation

Tammy Everts stands for the topic “page speed load” and is usually referenced to with other names like e.g. Steve Souders and Stefanov Stoyan. Just recently she released a presentation on “The Real Cost of Slow Time vs. Downtime“.

The Real Cost of Slow Time vs Downtime (Tammy Everts)

In general, the calculation for downtime losses is quite simple:

downtime losses = (minutes of downtime) x (average revenue per minute)

Calculating the cost for slow page performance is ways more tricky since the impact is deferred to the actual accurance of slow pages. The talk basically differentiates between short-term losses and long-term losses due to slow pages.

Short-Term losses

  1. Identify your cut-off performance threshold (4.4 seconds is a good industry value)
  2. Measure Time to Interact (TTI) for pages in flows for typical use cases on your site
  3. Calculate the difference of TTI and cut-off performance threshold
  4. Pick a business metric according to industry best practice. 1 second delay in page load time correlates to
    1. 2.1% decrease in cart size
    2. 3.5-7% decrease in conversion
    3. 9-11% decrease in page views
    4. 8% decrease in bounce rate
    5. 16% decrease in customer satisfaction
  5. Calculate losses

Long-Term losses

The long-term impact is calculated on a customer lifetime value (CLV) calculation basis. The relationship – according to studies – between CLV and performance is interesting. 9% of users will permanently abandon a site that is down temporarily – but 28% of users will never again visit a site showing inacceptable performance.

  1. Identify your site’s performance impact line (8 seconds is a good industry value). Above this timeline business really got impacted.
  2. Identify the percentage of traffic experiencing slower traffic than the impact line.
  3. Identify CLV for those customers
  4. Calculate loss knwoing that 28% of these customers will never return to your site.


Agile – criteria to look for in an Agile business

In February 2013, I made an attempt to define Agile on my blog. I ended in a quite high-level definition of Agile:

Agile is a collection of values and principles that encourage a certain type of behaviour: focus on value generation and collaboration.”

Just recently, I found an interesting blog by Rouan Wilsenach working with ThoughtWorks where he went one level deeper and explained “Four Attributes of an Agile Business

1. Feedback – “This is what my customer wants.”

In my definition this relates to focus on value generation. Companies need to put the customer in the center of all their efforts. Rouan refers to an interesting list / toolbox on experience design. Only if organizations take this attribute serious they will finally be successful applying principles of agility.

2. A responsive team – “Yes. We can do that.”

In my definition this very much relates to values and principles supporting collaboration. Responsiveness comes only with co-location. In my experience, true collaboration over a distance can only be achieved within a trusted environment. People need to trust and respect each other to become a distributed team. If they don’t know each other of follow slightly different goals, it’s very likely to fail. So, the team spirit can be created most easily when forming inter-disciplinary teams which are located ideally in the same room. Rouan refers to Conway’s law (comparison of code structures with organizational patterns)

3. A responsive code base – “It’s ready. Shall we release it?”

For me, this again a perfect example of value generation. Have a feature ready? Why not shipping it immediately? Great entry for principles like “Zero Bug Policy” or “Continuous Deployment”.

Furthermore, a responsive code base is a clean code base. People love to work on such a code base. It’s almost bug free, easy to read, simple to understand, documented. People are proud of what they’ve developed, created.

4. Continuous direction – “What do we do next?”

Again, this point goes as value generation. Why employing a bunch of people working hard on software development, building great products if there is no direction behind, no strategy?

Clearly one of the major tasks of managers in an agile environment is to set the strategy. Product people break this strategy down into epics and stories. So, what to do next? Pick the next story from the prioritized backlog.

So, for me Rouan picked some really great criteria and attributes for an agile business. They’re in line with my previous definition (which I like) and take it to a less abstract level.

Reducing staff leads to higher productivity – proof for Brooks’ law?

Recently, my teamlead agile methods pointed me to an interesting corelation. After a discussion we concluded with a really mind-boggling observation. A settled organization facing change will increase productivity when reducing staff headcount – in other words: “Reducing staff leads to higher productivity”.

Bang! But let me explain. For software development tracking and planing purpose we use JIRA – so we’re able to track the amount of created and closed software development related tasks quite easily. The headcount in software development, product management and UX/design can be obtained easily by – counting (we actually asked our HR department for support).

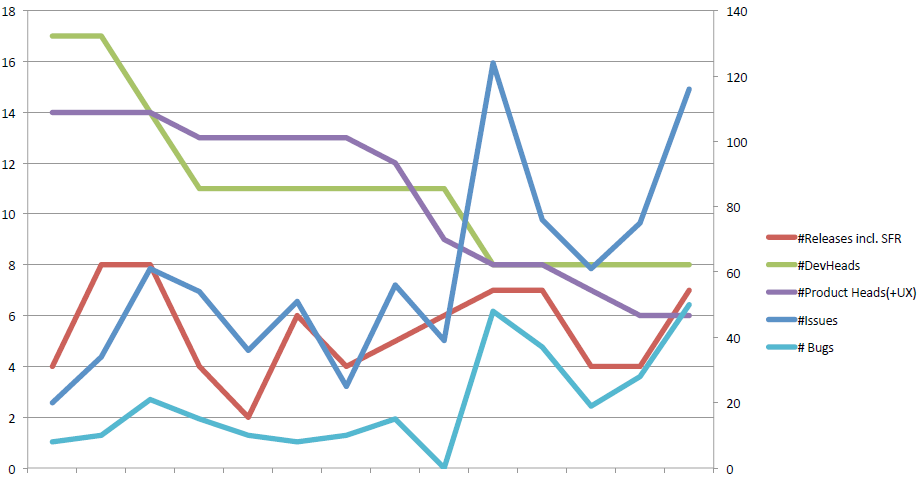
In our case we ended with this curve – impressively proving Brooks’s law.

Brooks Law in action

The graph shows a period from June 2013 (left) to July 2014 (right) and focuses only on one of our products at the time.

Green shows the number of software developers working on the product. Purple shows the number of product and UX/design people involved. The two curves are declining.

Red shows the amount of releases done in the period.The curve is trending towards a stable, flat curve.

Blue shows the amount of tickets closed and turquoise the amount of bugs closed. The two curves are decreasing trending towards a way higher plateau.

What happened? In June 2013 time frame we had a whole architecture team and quite some software developers organized in three teams working on our product. Around this point in time uncertainty hit the organization due to rumors of to-be-expected acquisition of our whole company. Uncertainty translates often to people leaving the organization. This can clearly be seen in the middle of the graphic. Surprisingly, the curves associated to work results don’t decline – as one would expect – but decrease even. So, productivity of the remaining staff increased! The most right date in the graph is July 2014 and reflects an organization which has one product team and one support team left. The architecture team disappeared completely, the team is ways lighter equipped with people.

What might we learn? Brooks’ law indicates that adding people to a project doesn’t automatically make the overall project finish faster. It might even end in a longer project run time. We’ve seen that removing people might result in better productivity. We think the fact of removing whole teams dedicated to special topics (in our case: the architecture team) helped to increase productivity in two ways. First, the responsibility of architecture decisions was pushed back into the teams and dead-lock situations where person A waits for a decision from person B just disappeared. Second, the time needed to communicate, agree and disagree simply vanished. Decisions had to be taken and nobody needed to be asked.

Is this a general pattern? I personally think this effect does only appear for a certain period of time. The drawback of such leaner organizations is obviously the lack of work on technical debt and architecture drawbacks. People in such situation focus on the obvious and postpone work on maintenance tasks for later. For me, it is definitely an observation I’d like to share with you. Perhaps you have similar experience? If so, please let me know.

Is there really a relation between the number of staff members and the productivity? Where is the limit? How can one push the limit?

Clean Code Developer Initiative – a structured learning way to skill improvement

“Clean Code – A Handbook of Agile Software Craftmanship” by Robert C. Martin is a classical reading for software developers. Great, but how do you get the spirit he described into the heads of your whole software development organization? The Clean Code Developer Initiative by Ralf Westphal and Stefan Lieser drafts an interesting way to improve the skills of your software developers with the spirit of Uncle Bob Martin’s book in mind.

The Clean Code Developer Initiative (CCDI) proposes a grade based system with color coding. It borrows concepts from game design by introducing a level concept. Entry level is marked with black and levels up via red, orange, yellow, green, blue to white.

For each level there are principles and practices listed which a software developer – or a whole department – should follow to get to the next level.

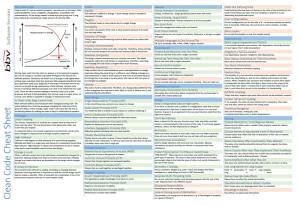
Urs Enzler from planetgeek.ch produced a nice Clean Code Cheat Sheet – it’s worth a look.

Clean Code Cheat sheet

There is a nice poster available by “unclassified software development“. It’s even possible to print it out in A0 format – huge!

Clean Code Developer Poster

The whole level of a developer can be shown through wristbands. Allow them to be proud on their achievements!

Clean Code Developer wristbands

I personally haven’t tried the effort to introduce the principles of Clean Code into a software development department – but it looks like it’s a feasible effort. Accompanied by trainings and some team events, it should be possible to appeal to the developer’s honor – and improve your software quality standards.

Reaching goals – lots of micro steps actually make the goal!

During Facebook’s developer conference f8 in 2014 Edwin Smith with the High-Performance Server Infrastructure team shared some insights on the HHVM – the PHP runtime project built around performance (27:37 onwards). In his talk he also described how the team almost failed reaching a very ambitious goal – but finally managed it … with 1% micro steps. They actually overachieved.

What happened? In October 2012 the team was in a position where they had spent nearly 2 years of development time to create a virtual machine / just-in-time compiler to boost Facebook’s execution performance. Already in April 2012 they realized that the newly created project was 3 times slower than the current execution environment – and plan to go live was end 2012. In October 2012 the team realized that following the working model as they did so far will not allow them to make their goal.

So, the need to improve the execution performance by factor 3+ (ambitious goal) meets a hard deadline to go live (time box).

At the time, the team stopped working like they did before and changed to a drastically different model.

New work model to achieve performance goals

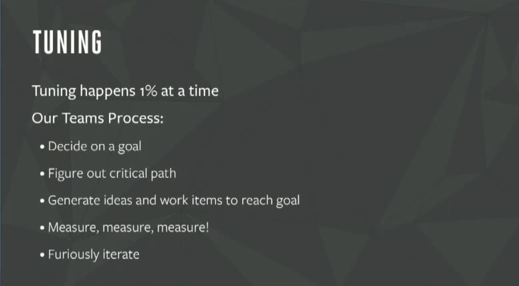
They changed from a project working model towards a kanban-like working model. Now, they started focusing on micro-steps. Each of these steps shouldn’t take longer than a day or two. If the success was measurable and positive, great. If not, the team simply documented the effort and moved on (Furiously iterate).

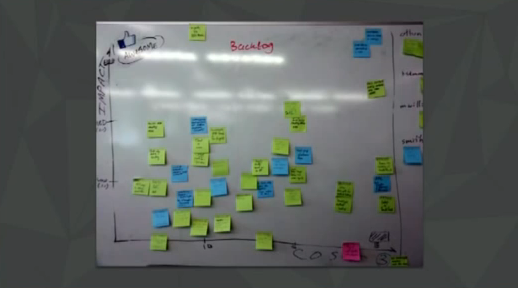
The backlog of ideas for HHVM performance improvements

Prior to starting the work on the final period from October to December the team started with a brainstorming session filling up their backlog. Each of these micro 1% performance improvment steps were documented. The backlog organized like: left–>right impact – with least impact right, top–>bottom effort with least effort in top. Ideally, all steps were located top left (low effort but high impact). Those, however, were already covered.

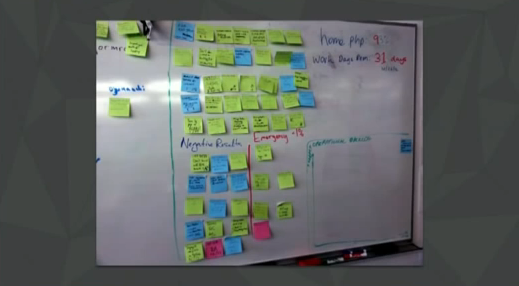
Tasks done during HHVM performance tuning period

The team documented the finished tasks with positive and no / negative impact on the board as well. A great learning experience.

Validation of the impact was done utilizing a fine grained measuring tool allowing the team to identify even smallest performance improvements.Facebook HHVM result

The result of the effort is amazing. The team managed – focusing on these micro-steps – to get to their goal – and even further.

The team did change to this working model since. They have periods of hard and focused work. They pick a goal and divide the path towards this goal into micro steps. They work for a small amount of time on one of these steps and decide on metrics (validation) to pivot (learning: wrong direction) or to persevere (learning: right direction). When the goal is reached the team does further fine-tuning on the achievements – or goes on vacation. Afterwards, they continue with another iteration.


Facebook and their mobile release process

The process of releasing software in a timely manner is highly business critical. Especially, the mobile release process is critical when moving towards a mobile-first strategy. The talk “Hacker Way: Releasing and Optimizing Mobile Apps for the World” (by Chuck Rossi @Facebook’s f8 conference in 2014) describes how Facebook turned its organization structure. This move was necessary to reflect the importance of mobile for Facebook’s future. Chuck heads the company’s release team and is responsible for all releases.

Impact of Mobile strategy on organization

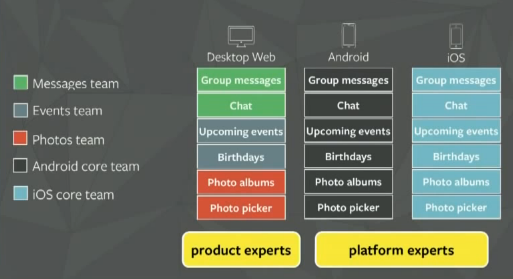
Before re-prioritizing everything within Facebook and focusing on mobile the development team was organized mainly around channels:

Development Organization of Facebook before moving towards mobile

This developer distribution led actually to heavy prioritization problems. The different product teams with focus on Desktop Web did prioritize their topics coming up with a numbered list of items. This prioritization were then handed over to the platform experts. They had the problem of seeing number #1 priority item of the “Messages team” competing with number #1 priority item of e.g. the “Events team”.

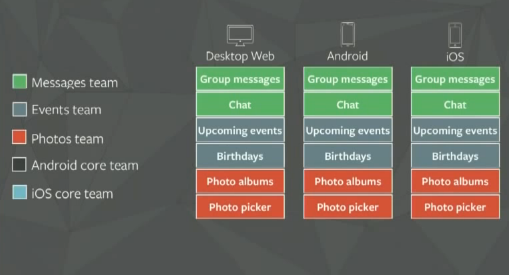
Facebook came over this organization issue by organizing their development differently:Development Organization of Facebook after moving towards mobile

Now, the Facebook engineering team has product and platform experts mixed working on features across all platforms.

Software Releases at Facebook

Facebook has some simple rules – simple but made of stone:

  1. WE SHIP ON TIME
    A
    release can not be postponed. If a feature can’t make it it will not make it into this release.
  2. MAKE USERS NO WORSE OFF
    Facebook is data driven. KPI’s are watched thorougly after a release. If they don’t develop as expected, a change needs to happen (e.g. fix forward or modification).
  3. THERE’S ALWAYS THE NEXT ONE
    Since the releases are already dated there is always the next release. If you can’t get your feature in today, it will be part of the release tomorrow. This relaxes the overall organization and takes away a lot of the pain experienced when the next release is month away.
  4. RETREAT TO SAFETY
    The release team is responsible for delivering a stable product. When the team actually picks the ready developed items (30 to 300 on a daily release) they carefully take the stories into the release candidate. It’s described as “subjective”. They follow a simple rule when building the release package: “If in doubt, there is no doubt”.

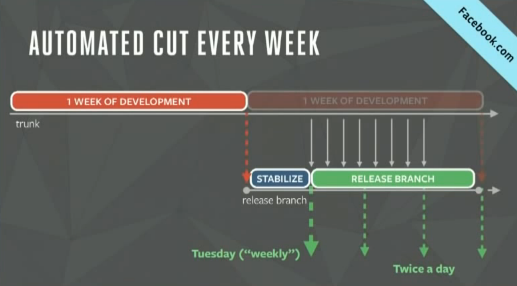
Facebook releases their web platform following a plan:Facebooks desktop web plattform release plan

Sunday, 6 p.m. the release team tags the next release branch. That’s done directly from the trunk. The release branch is stabilized until Tuesday, 4 p.m. and then released as a big release including 4000 to 6000 changes – 1 week of development. On Monday, Tuesday, Wednesday, Thursday, Friday, Facebook does two releases a day. These are cherry-picked changes – around 30 to 300 each release.

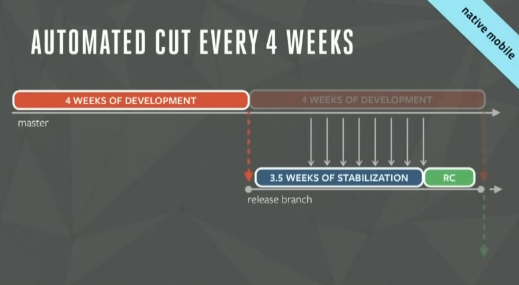
For Mobile the plan differs obviously a bit:Facebooks native web plattform release plan

On mobile the overall release principle is actually the same as described above. The development cycle is 4 weeks – on the day the previous release gets shipped to the various app stores, the next release candidate is taken from the master. The candidate is then 3,5 weeks into stabilization. Each candidate includes further 100-120 cherry picks taken during this 3 weeks stabilization period. When stabilization is over, the Release Candidate is tested and not touched any more.

Online dating and page speed – is there an impact on business?

The presentation “Getting page speed into the heads of your organization – a first hand report” () talks about the impact of web page speed and how to get the importance into the heads of your organization.
It also talks about the measured business impact of web page speed onto our online dating business. Those insights might be handy if you’re looking for recent information published in the context of web site performance impact on business. Our BI-team did an analysis of the impact of our performance improvements reported in the referenced presentation. Here’s our key learning.

What did we achieve?

  • We reduced the page load time by 27% from 2.96s to 2.15s
  • We reduced the app server response time by 25% from 365ms to 275ms.

What is the impact?

  • We reduced the number of profile resigns by 24%
  • We increased the number of messages by 71%

What does this mean?

In online dating, revenue is a function of activities. The more active people gather on an online dating site, the more revenue is typically seen in the business. Activity on the other hand is a complex function of ‘messages transported’, ‘searches done’, ‘profiles viewed’, ‘pictures seen’ and so on.

So, in our case. The decrease in page load time led directly to higher activity on our platform. Higher activity leads to higher revenues. We’ve seen our impact on revenues driven by reduced page load time.

Getting page speed into the heads of your organization – a first hand report

Just recently in Hamburg, I had the pleasure of talking to web site performance addicted people – on the 17th Web Performance Meetup. I talked about the way we at FriendScout24 got the importance of web page speed into the heads of our organization. The whole presentation is available publicly.


Best decision ever – skip the architect

The architect role is sold as outstanding important in product development efforts – especially when IT is involved. But I’ve learned some lessons.

The secret.de case – skip the architect

Roughly 3 years ago we started a new business – a high class and exclusive casual dating site focusing exclusively at women. The technical decision was soon done by picking Ruby on Rails v3 as web framework and mongoDB as persistence layer. It was a radical shift away from our current technology stack – pure java and postreSQL.

When we started with Sprint 0 we hired external people to support us. One person acted as the Ruby on Rails trainer for 1 week – to get our people up to speed. At the time we started we had 1 skilled Ruby on Rails person focusing on frontend development and one not-so-experienced person with Ruby on Rails focusing on backend development. The remaining team were skilled java developers. The other external people were one Rails nerd and an architect. During the sprints, it turned out that the architect didn’t have any clue about Rails nor pragmatic architecture. He started to document our project with ARC42 templates … so, we decided to put him aside soon. Leaving the team – without lead. No architect, no direction, no guidance – no hope?

Not at all. What happened? The team started to accept the fact that there’s no over-brain available. No-one making decisions for them. No-one giving direction. And, magically, they took over the ownership for the overall project. Each and every design decision was discussed within the team. Planning II got a total new meaning to the team. Sure, quite some mistakes were made – but most of them due to non-experience with the new technology stack. The Rails nerd was out-phased as soon as the platform went live – after 3,5 month of development.

So, in self-empowered teams there is no need for an explicit architect role. Naturally in team configurations there are more experienced people and less experienced people. A good team will distribute the overall responsibility for good architecture work over all heads. Everybody will carry a piece fitting their experience and willingness to contribute. Plus – you will not run into knowledge distribution problems. Everybody is involved. Knowledge is flowing. New persons can be introduced without a lot effort. The teams credo “fix it if it breaks” led to a low-maintenance and up-to-date system. So, I’ve a fast, fast, fast running application and a real high-performing team.

For me – in the end – the best decision ever was to skip the architect.