Website performance talk: Delivering The Goods In Under 1000ms

Paul Irish (@paul_irish) gave a really good keynot presentation during Front End Ops Conference 2014 in SF. The title: “Delivering The Goods In Under 1000ms“.

He focuses on investigating the key question “page size vs. number of requests” what has a bigger impact on website performance.

“… latency is the performance bottleneck for HTTP and well … most of the web”

Aggressive, but good goals to achieve:

Deliver a fast mobile web page load

  • Show the above-the-fold content in under 1 second
  • Serve above-the-fold content, including critical path CSS, in first 14kb of response

Maximum of 200ms server response time

Speed index under 1000

More to read about the Speed Index.

Website performance – best practice to improve

Website performance comes in various flavours – but where to start with improvements? How to improve the performance? What are best practices to follow?

Tony Gentilcore (@tonygentilcore) talks in a blogpost about “An engineer’s guide to optimization“. Tony basically identified 5 steps to follow.

Step 1: Identify the metric. 

Identify a scenario worth being optimized – means it moves a business metric. If – after all thinking and crunching – you’re not able to identify a scenario with a clear relationship between the optimization and any business metric you should look for more pressing problems first – and revisit the performance issue later.

Step 2: Measure the metric.

After you’ve identified the metric – establish a repeatable benchmark of this scenario / metric. Include this metric measurement into your continuous integration / delivery pipelines and watch out for regressions. First, start with synthetic benchmarks and later include the real world (Real User Monitoring).

Step 3: Identify the theoretical optimum of your metric.

Think about your scenario and create a best-best-best-case. What would be the benefit, the performance maximum to gain out of the scenario. Given everything works really well, what would be the top-performance figure?

Step 4: Approach your optimium.

Identify the bottlenecks preventing you to reach the optimum. Work on these bottlenecks – start with the biggest impact first. Don’t stop optimizing until you reach a point where you have to invest more than you benefit.

Step 5: Profit from your achievements!

Web frontend performance – distilled

Web frontend performance – distilled

Web performance used to be (in the good old server-only / server-rendering days) mainly dominated by the performance of your webservers delivering the dynamic content to the browser. Well, this changed quite a lot with application-like web frontends. Their main promise is to replace these annoying request/response pauses with one longer waiting period in the beginning of the session – but then have light-speed for subsequent requests.

Here are some really good links I just discovered today – they all deal with various aspects of frontend web-performance. Let’s start.

Comparing MV* frameworks? There is a great project – named TodoMVC – that compares various frontend-frameworks – amongst them are Backbone.js, AngularJS, Ember.js, KnockoutJS, Dojo, YUI, Agility.js, Knockback.js, CanJS, Maria, Polymer, React, Mithril, Ampersand, Flight, Vue.js, MarionetteJS, Vanilla JS, jQuery and a lot more.

Performance impact comparison by the filament group. A good effort on research was spent on the topic “Research: Performance Impact of Popular JavaScript MVC Frameworks” – focusing on e.g. Angular.js, Backbone.js and Ember.js. Performance testing was done with the previous mentioned implementation of TodoMVC. The raw data is accessible as well. Most interesting are the results (measuring avg. first render time):

Mobile 3G connection on Nexus 5

  • Ember averages about 5 seconds
  • Angular averages about 4 seconds
  • Backbone averages about 1 second

PC via LAN

  • Ember averages about 1.17 seconds
  • Angular averages about 0.88 seconds
  • Backbone averages about 0.29 seconds

Practical hints to accelerate responsive designed websites. In his post “How we make RWD sites load fast as heck” Scott Jehl (@scottjehl) gives some pracitcal hints on what to focus on:

  • Page wight isn’t the only measure; focus on perceived performance
  • Shortening the critical path
  • Going async
  • Inlining code
  • Shooting for 14kb
  • Taking advantage of caches
  • Using grunt in the deploy pipe

Angular 1.x and architecture problems. Another interesting blog article by Peter-Paul Koch (@ppk) focusses explicitly on Angular. “The problem with Angular” talks about severe performance problems with Angular 1.x versions. In his blog he notes

” … Angular 2.0, which would be a radical departure from 1.x. Angular users would have to re-code their sites in order to be able to deploy the new version …”

Wow. That’s interesting and a good indication for serious architecture issues with Angular 1.x …

Thought-leading companies and performance. Good articles / blog posts from leading companies on page speed performance:

The Real Cost of Slow Time vs. Downtime – great presentation

Tammy Everts stands for the topic “page speed load” and is usually referenced to with other names like e.g. Steve Souders and Stefanov Stoyan. Just recently she released a presentation on “The Real Cost of Slow Time vs. Downtime“.

The Real Cost of Slow Time vs Downtime (Tammy Everts)

In general, the calculation for downtime losses is quite simple:

downtime losses = (minutes of downtime) x (average revenue per minute)

Calculating the cost for slow page performance is ways more tricky since the impact is deferred to the actual accurance of slow pages. The talk basically differentiates between short-term losses and long-term losses due to slow pages.

Short-Term losses

  1. Identify your cut-off performance threshold (4.4 seconds is a good industry value)
  2. Measure Time to Interact (TTI) for pages in flows for typical use cases on your site
  3. Calculate the difference of TTI and cut-off performance threshold
  4. Pick a business metric according to industry best practice. 1 second delay in page load time correlates to
    1. 2.1% decrease in cart size
    2. 3.5-7% decrease in conversion
    3. 9-11% decrease in page views
    4. 8% decrease in bounce rate
    5. 16% decrease in customer satisfaction
  5. Calculate losses

Long-Term losses

The long-term impact is calculated on a customer lifetime value (CLV) calculation basis. The relationship – according to studies – between CLV and performance is interesting. 9% of users will permanently abandon a site that is down temporarily – but 28% of users will never again visit a site showing inacceptable performance.

  1. Identify your site’s performance impact line (8 seconds is a good industry value). Above this timeline business really got impacted.
  2. Identify the percentage of traffic experiencing slower traffic than the impact line.
  3. Identify CLV for those customers
  4. Calculate loss knwoing that 28% of these customers will never return to your site.


Online dating and page speed – is there an impact on business?

The presentation “Getting page speed into the heads of your organization – a first hand report” () talks about the impact of web page speed and how to get the importance into the heads of your organization.
It also talks about the measured business impact of web page speed onto our online dating business. Those insights might be handy if you’re looking for recent information published in the context of web site performance impact on business. Our BI-team did an analysis of the impact of our performance improvements reported in the referenced presentation. Here’s our key learning.

What did we achieve?

  • We reduced the page load time by 27% from 2.96s to 2.15s
  • We reduced the app server response time by 25% from 365ms to 275ms.

What is the impact?

  • We reduced the number of profile resigns by 24%
  • We increased the number of messages by 71%

What does this mean?

In online dating, revenue is a function of activities. The more active people gather on an online dating site, the more revenue is typically seen in the business. Activity on the other hand is a complex function of ‘messages transported’, ‘searches done’, ‘profiles viewed’, ‘pictures seen’ and so on.

So, in our case. The decrease in page load time led directly to higher activity on our platform. Higher activity leads to higher revenues. We’ve seen our impact on revenues driven by reduced page load time.

Getting page speed into the heads of your organization – a first hand report

Just recently in Hamburg, I had the pleasure of talking to web site performance addicted people – on the 17th Web Performance Meetup. I talked about the way we at FriendScout24 got the importance of web page speed into the heads of our organization. The whole presentation is available publicly.


Recommendations for building high traffic web software

The really great blog highscalability.com contains a post from Ashwanth Fernando on “22 Recommendations for Building Effective High Traffic Web Software“.

He shares insights from his work experience. Some of them seem to be very Oracle biased – but others are really down to earth and worth considering! The blog post is really worth reading. My favorites are:

  • Consider using a distributed caching framework
  • Consider splitting your web application into services
  • Do not use session stickiness
  • Do terminate SSL on the reverse proxy

Why my favorites? Well, some of them turned out to be really bad design decisions within one of our products …


Page Load time – how to get it into the organization?

Page load time is crucial. Business and technology people as individuals start understanding the importance of this topic almost immediately and are willing to support any effort to get fast pages out of your service.

But how can you foster a culture of performance and make people aware of the importance of this single important topic – amongst hundred other important topics?

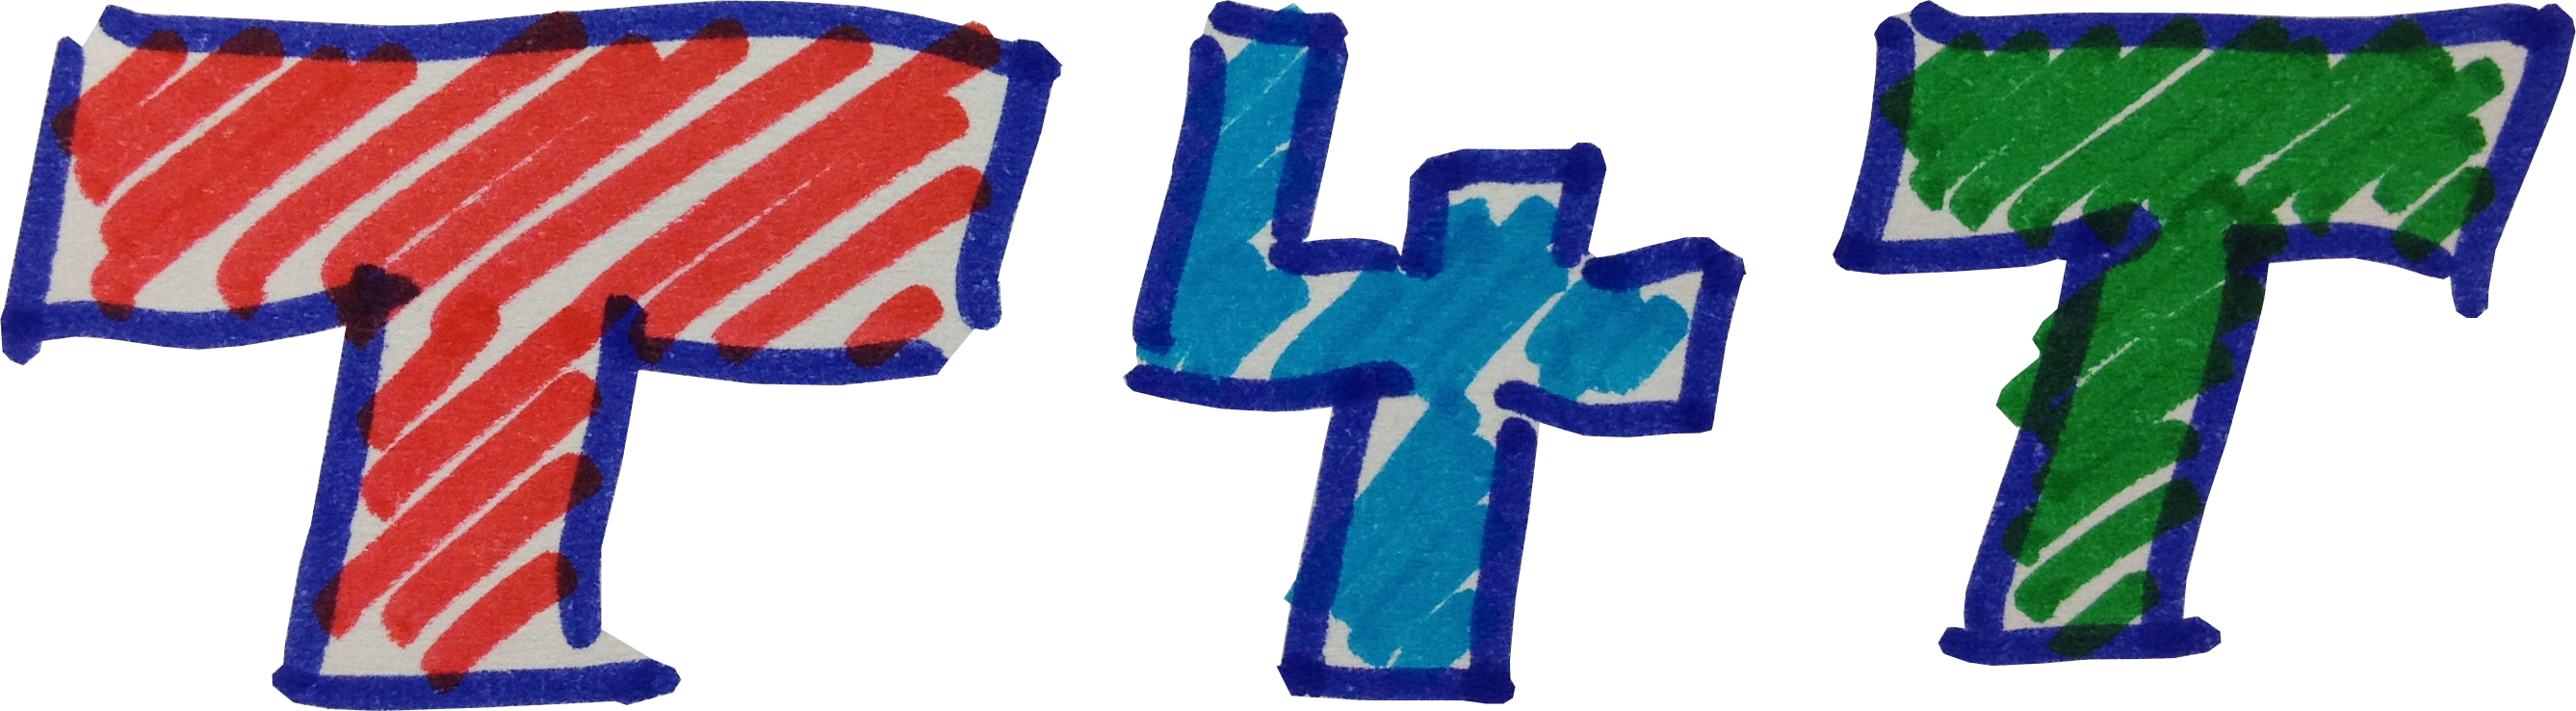
That was one of the challenges early 2013. Management and myself were convinced that 2013 one of our key focus topics is around web performance. t4t_optimizedThe birthday of “T4T”. The acronym stands for …

  • Two – Deliver any web page within 2 seconds to our customers.
  • 4 – Deliver any mobile web page within 4 seconds to our customers over 3G.
  • Two hundred – Any request over the REST API is answered below 200 milliseconds.

So, early 2013 we started T4T as an initiative to bring our page load times down to good values. To measure the page load time we experimented with two tools: Compuware’s Gomez APM tool and New Relic’s APM tool. Gomez was used initially for our Java based platform and New Relic for our Ruby on Rails platform. But we were able to measure and track-down some really nasty code segments (i.e. blocking threads in Java or 900 database requests in Ruby where 2 finally did the same job).

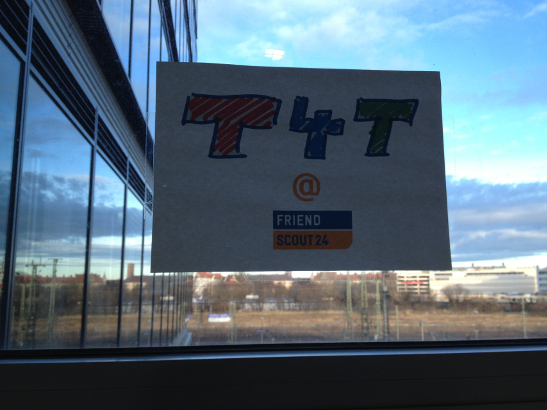
How did we get the idea of T4T into the organization? Any gathering of people with presentation character was used to hammer the message of web performance to the people. Any insight on the importance, any tip, hint, workshop, conference, article, blog post, presentation, anything was shared with the team. Furthermore, T4T was physically visible everywhere in the product development department:

T4T_closeup

THE LOGO – visible … everywhere … creepy!

T4T_Corner

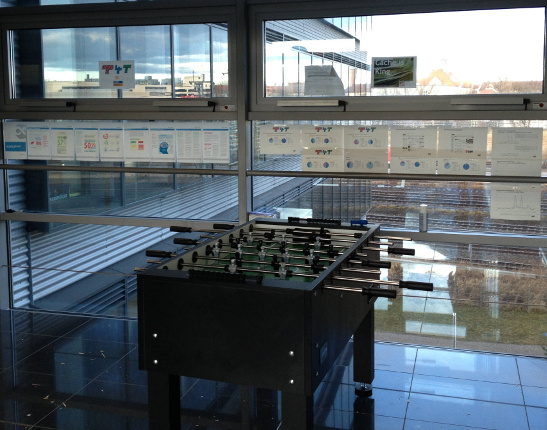
T4T logo and information on page load and web performance at the relax area for software developers and product owners …

T4T_VPOffice

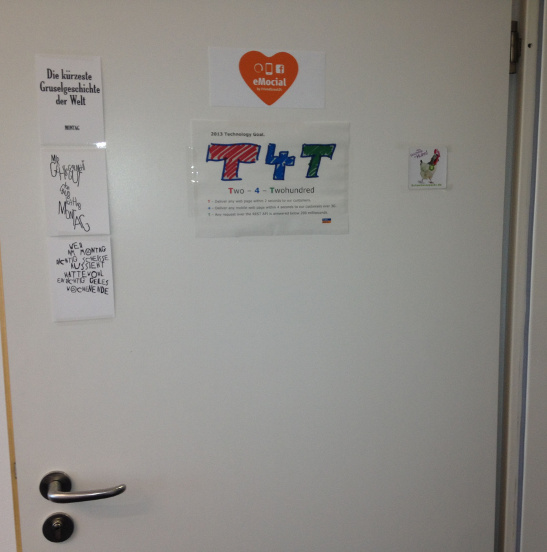
T4T at the VP office door.

For me, especially the endless talking about the topic, raising the importance, questioning of e.g. JPG picture sizes, special topic discussions on CSS sprites vs. standalone images or the usage of web-fonts for navigation elements helped a lot to raise the curiosity of people. Furthermore, giving them some room and time for research work helped a lot.

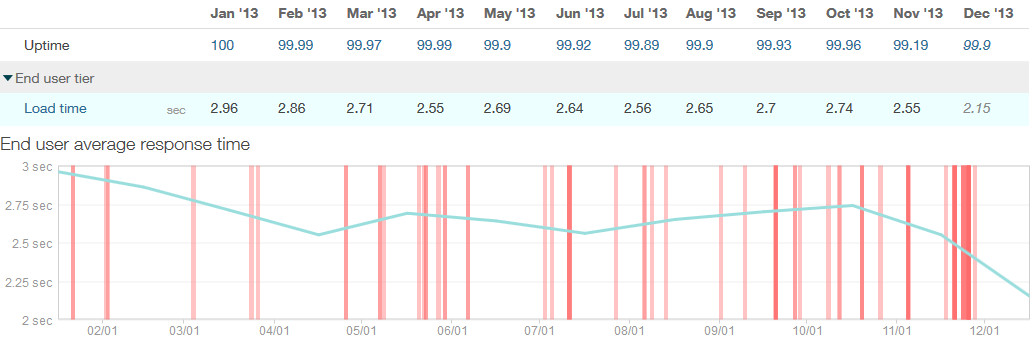
What did we achieve? Well, one of our platforms – based on Ruby on Rails started with page load time of 2,96s in January 2013. End 2013, the platform was at an impressive 2,15s page load time. In the same time, the amount of page views increased by factor 1,5!

Loadtime_secret_2013

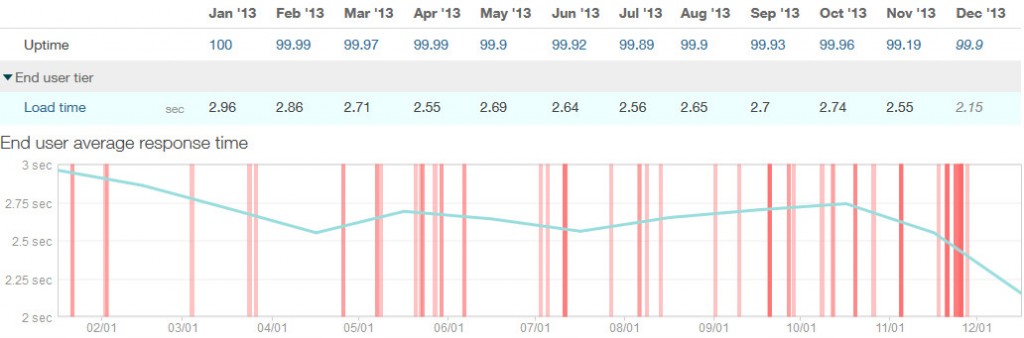
Page Load time over the year 2013

During the same time period, the App server response time dropped from 365ms to 275ms end of year – this time doubling the amount of requests in the same time.

Response_time_secret_2013

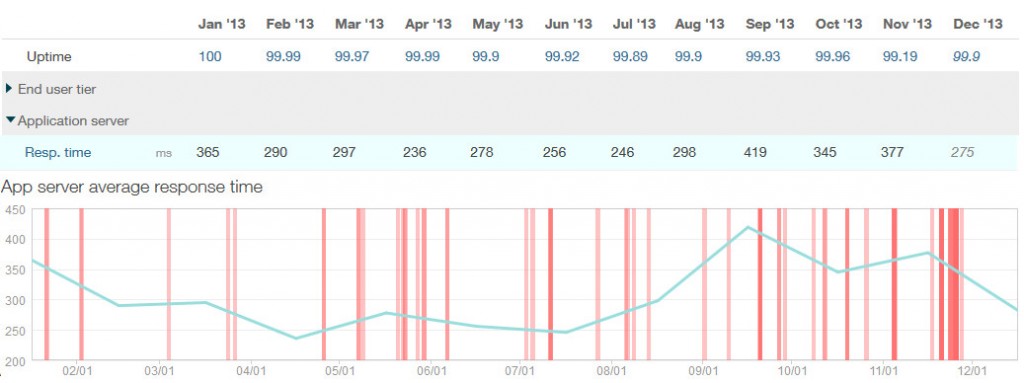
App server response time over the year 2013

Most interesting, we had one single release with a simple reshuffling of our external tags. Some of them now load asynchronously – or even after the onLoad() event. This helped us drop the page load time from around 2,5s to 2,1s – 400ms saved!

Impact_of_one_event_secret_adtags_after_onload

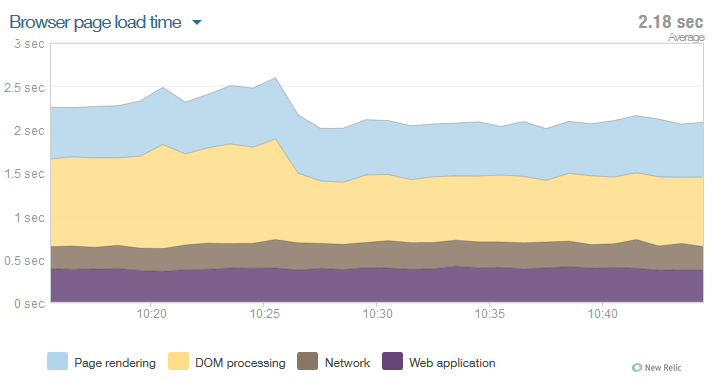
Impact of one single release and the move of adtags after the onLoad() event.

So, my takeaways on how to foster such a performance culture?

  1. You need a tangible, easy to grasp goal!
  2. Talk about the topic and the goal. Actually, never stop talking about this specific goal.
  3. Make the goal visible to anybody involved – use a logo.
  4. Measure your success.
  5. Celebrate success!
  6. Be patient. It took us 12 month …

Page Load time is crucial for a web service. Why?

For a technical person, page load time feels like being important. It’s a natural tendency, an instinct almost, to make everything perform best. Unfortunately, from a business perspective that’s not really a driver to impress people or make people being responsible for revenues to re-think the importance of page load time.

Why it might be of interest – also for business people?

There is a tight coupling between revenue and page load time in e-commerce businesses. The Infographic “How Loading Time Affects Your Bottom Line” shows slower page response time resulting in increased abandonment rates,  a Forrester study shows that 14% of online shoppers go to another site if they have to wait for a page to load – 23% will stop shopping, Shopzilla redesigned their site to load 5 seconds faster resulting in 10% revenue increase, Bing reported from a trial that a 2-second slowdown of page load time resulted in reduced revenues per user by 4,3%, Amazon measured a relation of 1% sales decrease for every 100 millisecond lost in page speed, and Google reported a revenue decrease by 20% for every 500 millisecond page performance loss, the Mozilla corporation behind Firefox managed to reduce the page load time of their download pages by 2.2 seconds resulting in 60 million additional downloads per year,

Why is it important for people? Why should web sites simply be fast?

There is this article “Our Need For Web Speed: It’s about neuroscience, not entitlement” from radware / strangeloop. It gives deeper insights into human nature and why it is important to run fast websites. A really good motivation for technical and non-technical people to think about the nature of performance. On web performance today, there is this infographic “This is your brain on a slow website” which picks up some of the arguments of the article in a displayable way.

Jakob Nielsen wrote in 2010 already in “Website Response Times” about the impact of slow web pages on humans and gives good reasons why we should definitely try to avoid this bad user experience.

Also good source of information to get an impression of the current state of the union: “Ecommerce Page Speed & Web Performance“.

Furthermore, there is this article on “How Facebook satisfied a need for speed“. Robert Johnson, director of engineering explains how Facebook boosted their speed by factor 2.

Another poster “Visualizing Web Performance” by strangeloop.