Where to start to speed up your IT environment – Here are 5 areas to look after.

Anil Cheriyan shared his thoughts on where to focus to create a fast and better working IT environment in the financial services industry – to speed up the organization (see: https://enterprisersproject.com/article/2017/6/suntrust-cios-formula-speed-relies-cloud-devops). In his post he mentioned 5 areas you should look after to break with old habits and start creating a fast pacing environment.

Anil Cheriyan is Director/Deputy Commissioner, Technology Transformation Services for the U.S. Federal Government. Previously, he was managing partner of Phase IV Ventures, a consulting and advisory firm.

Cloud

Two important aspects associated with the terminology “Cloud”. First it’s important to understand the implications of the various cloud strategies (ranging from private cloud over hybrid constructs towards public clouds). Get your strategy clear on which areas to host where. Criteria to look at are: business value provided, business continuity, resilience, security. Second aspect is the organization. Get your people involved. They need to participate in the strategy definition. They will execute them actually. No time for information hiding and bimodal IT infrastructures.

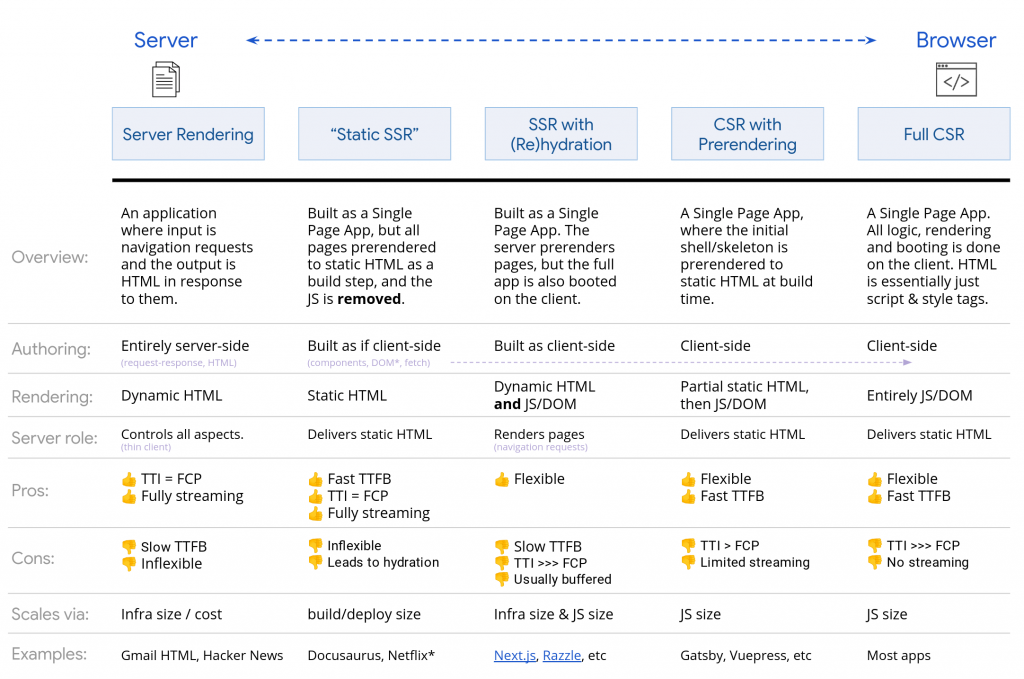
Modular architecture

Getting towards a modular architecture introduces flexibility in decisions, eliminates bottle necks and allows a decentralized governance. Today’s architectures are still monoliths or more advanced SOA stacks or somewhere in between. A more modular architecture exposes API’s via micro services. This architecture allows distributed ownership models. Complex is actually the implementation of these architecture rewrites. A lot of business related activities and the re-architecture work is a hard effort to combine.

DevOps

DevOps is finally all about the mindset of people and the break-up of silo-ed organizations. People need to learn and understand the importance of collaboration and trust. This sounds simple, turns out to be a heavy change project. Anil started pilot projects and introduced the true DevOps mindset and collaboration through success cases. It’s not about adopting rules and processes from the DevOps movement “by the books” – it’s about training your talent to work closer together.

Agile development

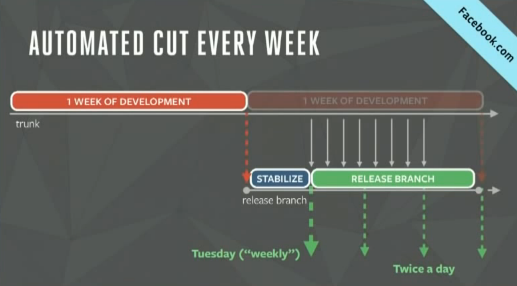
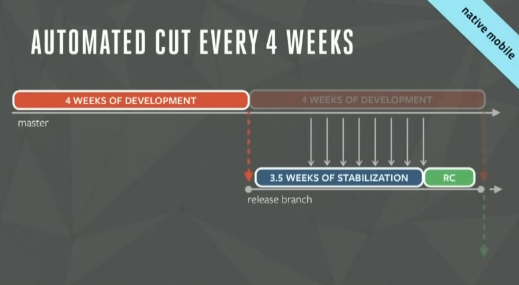
Agile development in software development is quite wide spread and commonly used. The acceptance over waterfall models is – where appropriate – high. Issues occur if the agile software development processes get surrounded by traditional waterfall-oriented functions – control functions. The most challenging part is to get agility into release management, deployment and integration testing.

Design thinking

Most important aspect of design thinking is the customer centricity. Understanding the real problems of the user to be solved is at the core of the approach. Not hunting the 100% perfect solution with all nice and “useful” features. Going for the most valuable solution, ship it fast. This requires heavy re-thinking within the organization. It’s more about talent and collaboration models. Important is to get people together with a thorough understanding of the industry and processes to help solving the customer’s pain points.

Architecture alternatives for rendering a web site

There’s a great overview of technologies available from Google comparing the different architecture options to render a web site. Jason Miller and Addy Osmani present options from SSR (server-side rendering) over various mixed models to complete CSR (client-side rendering). They describe the pros and cons of the various approaches and give hints on what to use in which situation. A great read!

https://developers.google.com/web/updates/2019/02/rendering-on-the-web

Rendering options

  • SSR: Server-Side Rendering – production of HTML is done on the server
  • CSR: Client-Side Rendering – creation of HTML is done on the client, usually using the DOM
  • Rehydration: Using a JavaScript based client app to show the server-rendered HTML – mixed with the DOM tree and associated data
  • Prerendering: generation of HTML is done during build time

Performance acronyms

  • TTFB: Time to First Byte – time between clicking a link and the first bit of content
  • FP: First Paint – time until any pixel gets visible to the user
  • FCP: First Contentful Paint – time until the requested content (article, body, ..) becomes visible
  • TTI: Time To Interactive – time until a page becomes interactive

Jason and Addy wrap their great article up with an overview of the options. Since it’s presented under Creative Commons Attriubtion 3.0 License I decided to reproduce it here for further reference.

Realistic case study on agile development at large scale

A Practical Approach to Large-Scale Agile Development” by Gary Gruver, Mike Young and Pat Fulghum is a real-world example on how scaling of agile software development really works in a huge software producing organisation.

A Practical Approach to Large-Scale Agile Development

The authors describe in an easy-to-read language the journey of the HP firmware organisation starting in 2008 and taking around 3 years with a clear goal in mind: “10x developer productivity improvement”.

In the beginning they were stuck with a waterfall planning process with a huge planning organisation and not being able to move in software development as fast as business expected. A quick summary of activities showed that in the beginning the organization was spending 25% of developer time in planning sessions to plan the next years’ releases. Only 5% was spent on innovation. Nowadays, after acomplishing the 10x goal, 40% of developer’s time is spent on innovation.

The book highlights the relevance of a right mix of agile technologies with a good approach in software architecture and organisational measures to form a successful team of people striving for common goals. A fascinating read!

Most striving is the unemotional view on agile and how to apply it. They purposefully decided not to have self-organizing teams. So, agile is broken? Can’t be applied in such an environment? Not at all! The authors give good reason for not applying all agile patterns from the books – and it is working.

Website performance talk: Delivering The Goods In Under 1000ms

Paul Irish (@paul_irish) gave a really good keynot presentation during Front End Ops Conference 2014 in SF. The title: “Delivering The Goods In Under 1000ms“.

He focuses on investigating the key question “page size vs. number of requests” what has a bigger impact on website performance.

“… latency is the performance bottleneck for HTTP and well … most of the web”

Aggressive, but good goals to achieve:

Deliver a fast mobile web page load

  • Show the above-the-fold content in under 1 second
  • Serve above-the-fold content, including critical path CSS, in first 14kb of response

Maximum of 200ms server response time

Speed index under 1000

More to read about the Speed Index.

Website performance – best practice to improve

Website performance comes in various flavours – but where to start with improvements? How to improve the performance? What are best practices to follow?

Tony Gentilcore (@tonygentilcore) talks in a blogpost about “An engineer’s guide to optimization“. Tony basically identified 5 steps to follow.

Step 1: Identify the metric. 

Identify a scenario worth being optimized – means it moves a business metric. If – after all thinking and crunching – you’re not able to identify a scenario with a clear relationship between the optimization and any business metric you should look for more pressing problems first – and revisit the performance issue later.

Step 2: Measure the metric.

After you’ve identified the metric – establish a repeatable benchmark of this scenario / metric. Include this metric measurement into your continuous integration / delivery pipelines and watch out for regressions. First, start with synthetic benchmarks and later include the real world (Real User Monitoring).

Step 3: Identify the theoretical optimum of your metric.

Think about your scenario and create a best-best-best-case. What would be the benefit, the performance maximum to gain out of the scenario. Given everything works really well, what would be the top-performance figure?

Step 4: Approach your optimium.

Identify the bottlenecks preventing you to reach the optimum. Work on these bottlenecks – start with the biggest impact first. Don’t stop optimizing until you reach a point where you have to invest more than you benefit.

Step 5: Profit from your achievements!

Web frontend performance – distilled

Web frontend performance – distilled

Web performance used to be (in the good old server-only / server-rendering days) mainly dominated by the performance of your webservers delivering the dynamic content to the browser. Well, this changed quite a lot with application-like web frontends. Their main promise is to replace these annoying request/response pauses with one longer waiting period in the beginning of the session – but then have light-speed for subsequent requests.

Here are some really good links I just discovered today – they all deal with various aspects of frontend web-performance. Let’s start.

Comparing MV* frameworks? There is a great project – named TodoMVC – that compares various frontend-frameworks – amongst them are Backbone.js, AngularJS, Ember.js, KnockoutJS, Dojo, YUI, Agility.js, Knockback.js, CanJS, Maria, Polymer, React, Mithril, Ampersand, Flight, Vue.js, MarionetteJS, Vanilla JS, jQuery and a lot more.

Performance impact comparison by the filament group. A good effort on research was spent on the topic “Research: Performance Impact of Popular JavaScript MVC Frameworks” – focusing on e.g. Angular.js, Backbone.js and Ember.js. Performance testing was done with the previous mentioned implementation of TodoMVC. The raw data is accessible as well. Most interesting are the results (measuring avg. first render time):

Mobile 3G connection on Nexus 5

  • Ember averages about 5 seconds
  • Angular averages about 4 seconds
  • Backbone averages about 1 second

PC via LAN

  • Ember averages about 1.17 seconds
  • Angular averages about 0.88 seconds
  • Backbone averages about 0.29 seconds

Practical hints to accelerate responsive designed websites. In his post “How we make RWD sites load fast as heck” Scott Jehl (@scottjehl) gives some pracitcal hints on what to focus on:

  • Page wight isn’t the only measure; focus on perceived performance
  • Shortening the critical path
  • Going async
  • Inlining code
  • Shooting for 14kb
  • Taking advantage of caches
  • Using grunt in the deploy pipe

Angular 1.x and architecture problems. Another interesting blog article by Peter-Paul Koch (@ppk) focusses explicitly on Angular. “The problem with Angular” talks about severe performance problems with Angular 1.x versions. In his blog he notes

” … Angular 2.0, which would be a radical departure from 1.x. Angular users would have to re-code their sites in order to be able to deploy the new version …”

Wow. That’s interesting and a good indication for serious architecture issues with Angular 1.x …

Thought-leading companies and performance. Good articles / blog posts from leading companies on page speed performance:

The Real Cost of Slow Time vs. Downtime – great presentation

Tammy Everts stands for the topic “page speed load” and is usually referenced to with other names like e.g. Steve Souders and Stefanov Stoyan. Just recently she released a presentation on “The Real Cost of Slow Time vs. Downtime“.

The Real Cost of Slow Time vs Downtime (Tammy Everts)

In general, the calculation for downtime losses is quite simple:

downtime losses = (minutes of downtime) x (average revenue per minute)

Calculating the cost for slow page performance is ways more tricky since the impact is deferred to the actual accurance of slow pages. The talk basically differentiates between short-term losses and long-term losses due to slow pages.

Short-Term losses

  1. Identify your cut-off performance threshold (4.4 seconds is a good industry value)
  2. Measure Time to Interact (TTI) for pages in flows for typical use cases on your site
  3. Calculate the difference of TTI and cut-off performance threshold
  4. Pick a business metric according to industry best practice. 1 second delay in page load time correlates to
    1. 2.1% decrease in cart size
    2. 3.5-7% decrease in conversion
    3. 9-11% decrease in page views
    4. 8% decrease in bounce rate
    5. 16% decrease in customer satisfaction
  5. Calculate losses

Long-Term losses

The long-term impact is calculated on a customer lifetime value (CLV) calculation basis. The relationship – according to studies – between CLV and performance is interesting. 9% of users will permanently abandon a site that is down temporarily – but 28% of users will never again visit a site showing inacceptable performance.

  1. Identify your site’s performance impact line (8 seconds is a good industry value). Above this timeline business really got impacted.
  2. Identify the percentage of traffic experiencing slower traffic than the impact line.
  3. Identify CLV for those customers
  4. Calculate loss knwoing that 28% of these customers will never return to your site.


Facebook and their mobile release process

The process of releasing software in a timely manner is highly business critical. Especially, the mobile release process is critical when moving towards a mobile-first strategy. The talk “Hacker Way: Releasing and Optimizing Mobile Apps for the World” (by Chuck Rossi @Facebook’s f8 conference in 2014) describes how Facebook turned its organization structure. This move was necessary to reflect the importance of mobile for Facebook’s future. Chuck heads the company’s release team and is responsible for all releases.

Impact of Mobile strategy on organization

Before re-prioritizing everything within Facebook and focusing on mobile the development team was organized mainly around channels:

Development Organization of Facebook before moving towards mobile

This developer distribution led actually to heavy prioritization problems. The different product teams with focus on Desktop Web did prioritize their topics coming up with a numbered list of items. This prioritization were then handed over to the platform experts. They had the problem of seeing number #1 priority item of the “Messages team” competing with number #1 priority item of e.g. the “Events team”.

Facebook came over this organization issue by organizing their development differently:Development Organization of Facebook after moving towards mobile

Now, the Facebook engineering team has product and platform experts mixed working on features across all platforms.

Software Releases at Facebook

Facebook has some simple rules – simple but made of stone:

  1. WE SHIP ON TIME
    A
    release can not be postponed. If a feature can’t make it it will not make it into this release.
  2. MAKE USERS NO WORSE OFF
    Facebook is data driven. KPI’s are watched thorougly after a release. If they don’t develop as expected, a change needs to happen (e.g. fix forward or modification).
  3. THERE’S ALWAYS THE NEXT ONE
    Since the releases are already dated there is always the next release. If you can’t get your feature in today, it will be part of the release tomorrow. This relaxes the overall organization and takes away a lot of the pain experienced when the next release is month away.
  4. RETREAT TO SAFETY
    The release team is responsible for delivering a stable product. When the team actually picks the ready developed items (30 to 300 on a daily release) they carefully take the stories into the release candidate. It’s described as “subjective”. They follow a simple rule when building the release package: “If in doubt, there is no doubt”.

Facebook releases their web platform following a plan:Facebooks desktop web plattform release plan

Sunday, 6 p.m. the release team tags the next release branch. That’s done directly from the trunk. The release branch is stabilized until Tuesday, 4 p.m. and then released as a big release including 4000 to 6000 changes – 1 week of development. On Monday, Tuesday, Wednesday, Thursday, Friday, Facebook does two releases a day. These are cherry-picked changes – around 30 to 300 each release.

For Mobile the plan differs obviously a bit:Facebooks native web plattform release plan

On mobile the overall release principle is actually the same as described above. The development cycle is 4 weeks – on the day the previous release gets shipped to the various app stores, the next release candidate is taken from the master. The candidate is then 3,5 weeks into stabilization. Each candidate includes further 100-120 cherry picks taken during this 3 weeks stabilization period. When stabilization is over, the Release Candidate is tested and not touched any more.

Online dating and page speed – is there an impact on business?

The presentation “Getting page speed into the heads of your organization – a first hand report” () talks about the impact of web page speed and how to get the importance into the heads of your organization.
It also talks about the measured business impact of web page speed onto our online dating business. Those insights might be handy if you’re looking for recent information published in the context of web site performance impact on business. Our BI-team did an analysis of the impact of our performance improvements reported in the referenced presentation. Here’s our key learning.

What did we achieve?

  • We reduced the page load time by 27% from 2.96s to 2.15s
  • We reduced the app server response time by 25% from 365ms to 275ms.

What is the impact?

  • We reduced the number of profile resigns by 24%
  • We increased the number of messages by 71%

What does this mean?

In online dating, revenue is a function of activities. The more active people gather on an online dating site, the more revenue is typically seen in the business. Activity on the other hand is a complex function of ‘messages transported’, ‘searches done’, ‘profiles viewed’, ‘pictures seen’ and so on.

So, in our case. The decrease in page load time led directly to higher activity on our platform. Higher activity leads to higher revenues. We’ve seen our impact on revenues driven by reduced page load time.