One transformation technique Marty recommends is the Discovery Sprint. He recommends to do a Discovery Sprint when a team struggles to learn how to do product discovery, when the team has something big and critically important to solve or if the team is just moving too slowly. Marty talks more about it on his blog https://svpg.com/discovery-sprints/ and refers to the Book “Sprint” by Jake Knapp et al.
Another is named Pilot Teams. The idea behind the Pilot Teams is to create success within a smaller protected environment and convince doubtful or fearful or lazy people to follow the change process. The principle is borrowed from the technology adoption curve (aka “Gartner Hype Cycle”) – some people are early adopters, others are less eager. Chris Jones from SVPG talks about this technique in “Pilot Teams“. With these pilot teams the idea of A/B testing – well known from product development – can be applied to organization development as well.
Outcome-based Roadmaps is yet another way to start the transformation process. Simply continue working with product roadmaps, however introduce two differences. First, annotate every roadmap item with its associated expected business result. Every time this item is discussed highlight the expected business result. Second, after the launch of an roadmap item report immediately the actual result vs. the expected result. So, during the next 3-12 month the opportunity assessment information will get its way into the roadmap. For prioritization try to move away from prioritizing ideas to problems.
Common Product Discovery Pitfalls
Marty mentions several pitfalls he experienced and saw teams struggle with. He talks a lot more in his blog post on “Product Discovery: Pitfalls and Anti-Patterns“. Here’s just a summary and some notes.
Confirmation-biased Discovery The team and / or the stakeholders are not really interested in the results of Discovery, they just need affirmation.
Product as Prototype Discovery The team pretends working on a prototype implementation but it takes too long to actually get the prototype shipped (e.g. 4 month).
Partial Team Discovery Not Technology, UX and Product go see the customer, it’s only Product + UX.
One-Dimensional Discovery The team focusses only on quantitative or qualitative validation and draws wrong or incomplete conclusions.
Big Bang Discovery The team works on a single, big release shipped within a lengthy time frame. They don’t work in an iterative mode.
Outsourced Discovery The organization / stakeholders hired a “creative” agency to do the creative Discovery work. The implementation should then be picked up by the team.
Culture Baseline of successful companies
“If we get the culture right, most of the other stuff will happen naturally on its own.”
Tony Hiseh, CEO Zappos
Tackle Risks up Front
Value Risk – will they use / buy it?
Usability Risk – can they us it?
Feasibility Risk – can we build it?
Business Viability Risk – will our stakeholders support it?
Define Products Collaboratively, not Sequentially
Product Management
Product Design
Engineering
Focus on Business Results, not Output
Product teams exists to solve problems in ways that your customers love, yet work for your business.
This blog post is part of a series. It summarizes my personal notes of the workshop held by Marty Cagan “How to Create Tech Products Customers Love” from 5th to 6th of June in 2019 in San Francisco.
Variable compensation models and motivation – an experience report
We’re quite a young and digital organization. Our shareholder – a big publishing house – demands variable portions of the salary as a motivational factor. If that’s set in stone, you better look how to implement it best. Since 2015, we implemented variants of a variable compensation model and I’d like to share some of our learnings on the various models.
Salaries in the knowledge workers’ world
Today’s salaries usually have at least two components: the fixed part (paid usually every month) and the variable part (paid usually quarterly, twice or once per year). The fixed part represents the compensation for the working hours and fulfillment of the work contract. The variable portion can vary according to the agreed targets. Depending on the degree of achieving the targets the multiplier for the variable portion may vary from 0 to 1.5 or even higher.
Motivation and knowledge worker
My absolute favourite to understand motivation – and the impact of money on knowledge worker is the video by RSA describing Dan Pink’s thinking behind his book “Drive”: https://www.youtube.com/watch?v=u6XAPnuFjJc (10m 47s definitely worth watching!)
Motivation = three major ingredients: Mastery, Autonomy, Purpose.
Mastery is an intrinsic driver of knowledge worker. They want to improve their skills, they want to get better and better. A great workplace environment takes this into account and leaves room for people to practice, practice, practice. Autonomy gives people space to solve the problems they’re working on. Nobody tells them how to do so, nobody’s looking at the output. Only the outcome counts. Purpose sets the work activities into a greater context. Everything has a meaning, people understand why they do what they do. They see the greater picture, the vision. Purpose, in my opinion, is the most important ingredient for motivation. Put all three together as a fundament for a work environment and you have very likely intrinsically motivated people.
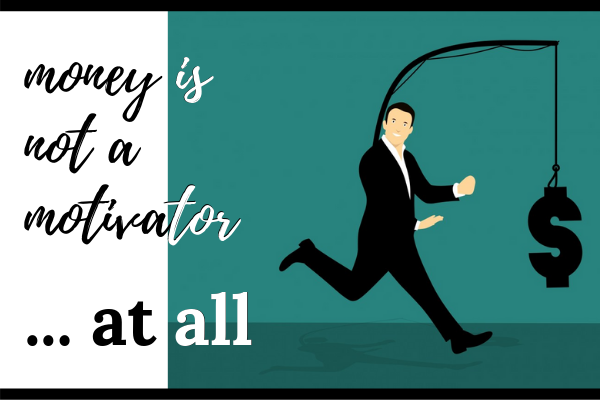
Money, on the other hand, as a benefit for work kills motivation. It is nice to receive your variable salary once, twice or 4 times a year. It’s a nice way for your boss to say “Well done, thank you!”. BUT the money is not a long lasting instrument to create or increase motivation (look at 2:12 into the video – they present research results there …).
So, why do we still have variable salaries to push motivation and output?
I know quite some young companies, some startups, some larger organizations who operate 100% on fixed salaries. They understood the basic principle of motivation and compensation. On the other side there are still some old, traditional and rusty organizations with variable compensation plans. Some decades ago, they connected the compensation to personal goals and never questioned themselves. Or it’s so common, they can’t even think about getting away from this model.
2015 – The “yearly revenue and individual targets”-model
Management sets a revenue target and every employee and his/her manager agrees individually on targets. The thesis behind the model: money is a key motivator to achieve top performance. The variable part of the salary is 100% connected to a company revenue goal and one or many individual goals.
We observed lengthy and excessive negotiations on individual goals with our employees. Even worse, the just-agreed goals hold just 4-6 weeks until they need refinement. Furthermore, we observed individuals stating they couldn’t help each other because this action would directly conflict with them achieving their goals. In essence, the model leads to people optimizing their personal benefits and defocusses company goals.
2016 – The “yearly revenue and department targets”-model
Management sets a revenue goal and each department head sets a yearly department target. The department target (e.g. “Reduce page load time to less than 2 seconds”) holds for the whole year and is always present. It will influence the way people work together but is not always a focus topic. The department target occurs in the variable compensation plans for all department employees. Thesis behind this model is again: money is a key motivator to achieve top performance. The variable portion of the salary is again connected 100% to the company revenue goal and one or many department goals.
Applying this model we observed less conflicts between individual employees. It’s quite time consuming during the identification of the department goals. They need strong alignment amongst each other. We managed to achieve quite good alignment – however had some occasions where people ended in conflicting department goal discussions. In the end the whole staff focussed ways more on achieving the department goals – better than with the previous model. However, the organization didn’t “feel” aligned on joint goals, more trying to achieve the department goals. Producing shiny winners on the cost of the overall company targets.
2017 – The “yearly revenue and quarterly company targets”-model
Don’t name the model OKR. We successfully burned OKR in 2014. Tried to implement it without external, experienced help. It ended in a process-by-the-book implementation and a perception of a grass-root democratic, inefficient and cluttered way to set 4 management and 4 team targets per quarter.
In this model, the management sets a yearly revenue target and company targets for the next 3 month. The company targets include everybody in the company – no matter what function or department. The targets need to be S.M.A.R.T. (Specific, Measurable, Achievable, Relevant, Timebound) and led to quite some discussion during definition – both between department heads and employees. The targets include e.g. specific product features, specific sales products or marketing activities. Thinking behind this model: everybody sits in the same boat and again money is a key motivator to achieve top performance. The variable portion of the salary is connected 100% to the company revenue goal and quarterly company goals.
During the implementation of this model we found “same company, same targets” led to some motivation for the active influencer for the goals (e.g. product, technology, sales, marketing) and quite some frustration for those having no influence at all (e.g. finance, HR, administration). They had to rely on their colleagues delivering the best job possible. On the other hand, we were able to set relevant goals for the next 3 month and were able to steer the company in a clever and agile way through the rough sea of economical changes. We had the staff members being focussed on achieving few topics of high relevance for the company.
We also learned – the hard way – that goal achievement communication can lead to some confusion and irritation if not done 100% transparent. And setting quarterly goals leads to quite some overhead to define goals every 12 weeks. Agility comes with a price tag!
2018 – The “100% guaranteed and 150% possible”-model
2017 ended with some really bad environmental messages for our business model. We needed to change quite some things. Amongst them was the variable compensation model. Our ambition at the time was to bring maximum calm to the staff members and allow them to focus on the company’s focus goals. One measure was to put away the variable portion of the compensation model. We guaranteed 100% of the bonus and made 150% possible if we achieved a specific traffic target earlier than we expected it.
Thinking behind this model is (see Dank Pink above): money doesn’t have any influence on work performance, but it has on work morale. We decoupled the compensation from achieving targets – allowing people to work on the company’s focus topics. And as a bonus, there is this 150% stretch goal. Nice to achieve – and desirable – but it just sits there.
We observed almost no discussion on compensation and fairness / unfairness of goals. People focused on getting the job done. I’d refer to the state of people as “intrinsic motivated”. At year end we didn’t manage to catch the 150% goal which led again to some frustration amongst the team. Furthermore, some specific departments (e.g. sales) perceive “100% fixed” less as an adorable state. For them it’s less motivating since their working model always follows includes “catching numbers”.
2019 – The “revenue and EBIT goal”-model
Beginning 2019 we found ourselves in a more stable environment and switched back to a variable compensation model. This time, we decided to focus on setting company wide financial goals. Everybody is able to influence them and the effort setting them is limited. The goal is set end 2018 for the whole year.
The thinking behind this model: money doesn’t have any influence on work performance, but it has on work morale. At a first glance, the model doesn’t look like an advancement but it effectively decouples financial goals from specialist topics. It’s the same for everybody and done once a year. So far, so good. It turns out to be a bit problematic since the environmental conditions changed quite a bit and the target corridors defined end 2018 are no longer achievable. So an adjustment is needed!
Which model worked best so far?
The 2015, 2016 and 2017 models worked better and better each year. Still having significant flaws with the direct connection between motivation and money paid. But the got better.
2018 was the most successful model so far. Less friction, lots of motivation and high pace – outcome over output. But we also had some frustration in performance-oriented departments (e.g. sales).
2019 doesn’t feel like an advancement from 2018. But 2019 is not over – let’s see.
The holy grail? Well, I don’t think we found it – so, we need to move on and adapt.
Software projects failed a lot in the past. They failed to deliver the value for the business, were too late or ways out of budget. The selected process method was usually the scapegoat for the failure with agile methods being the answer to any question in software development. But as usually in live, it’s not black or white. The selection of the right software process method depends on the surrounding of the project. I gathered some industry input and combined it to reflect the current thinking regarding agile software development methods vs. traditional methods.
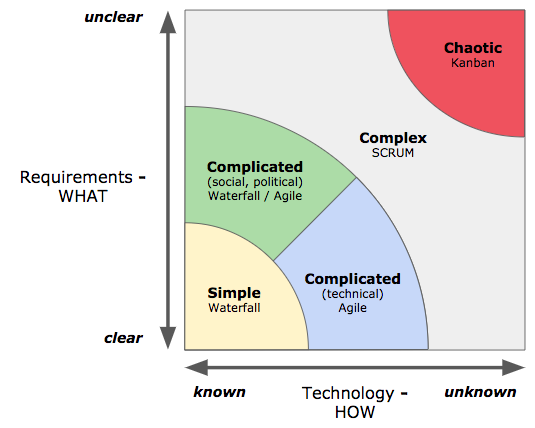
The adapted Stacey matrix
Adapted Stacey Matrix for technology / software development environment
The original stacey matrix supports decision making processes suggesting appropriate management actions and defines four areas: simple, complicated, complex and chaotic. The suggested actions depend heavily on the context of the decision making.
The dimensions of the adapted matrix: HOW and WHAT
The x-axis of the adapted matrix deals with the HOW. If the team knows the technology well and has used it many times before, we’re on the left. Otherwise, if the technology is completely new to the team we’re on the right of the dimension. The y-axis positions the WHAT. On the bottom of the axis, the stakeholder of the project all agree on the goals and have the same understanding of the expected outcome. On top it’s the opposite, no agreed requirements and no alignment on expectations. The individual mix of the project points to a certain area with a process model suggestion in the adapted matrix.
Waterfall …
Waterfall is a traditional project management method with sequential steps and no iterations. Massive upfront planning is done before any implementation work starts. If all goals and steps are clear, waterfall produces consistent results in a predictable and repeatable way. The clearly defined tasks lead to an optimized sequencing and optimal resource allocation. Waterfall optimizes resources and return on invest if cause and effects are clear to anybody in the project team.
… vs. Agile
Agile stands for SCRUM, Kanban and LEAN methods with flexibility, quick response and constantly changing environments in mind. They start quicker with smaller scope for the current increment with the scope being like a rolling window. Uncertainty of the projects’ goals needs quick adjustment and adaptation during the whole execution. Only close and frequent collaboration with all team members make agile projects successful. If causes and effects aren’t clear, agile works in small steps towards a value-generating and broadly accepted result.
Simple to chaotic – from “known knowns” to “unknowables”
Simple = easily knowable, the known knowns
Projects in the simple zone unveil very few surprises, decisions are fact- or evidence-based, advancement occurs in orderly, sequential steps and the WHAT is clear to anybody. Any size projects with clear activities and repeatable results fits in this category. It has been done multiple times before and best practices exist as benchmarks. The process is simple and could be handled in a check-list style.
Going forward in a simple, fully predictable project means reducing it to the maximum to make the single pieces easier to understand. Examples of simple: recipes, tasks on an assembly line, checklist based work.
Complicated = not simple but still knowable, the known unknowns
The complicated zone segments into socially and politically complicated and technically complicated. Complicated means less simple but still somewhat predictable.
In Social/political complicated environments people can not agree on the purpose of the project and the expectation on results is not clear. Requirements are conflicting amongst the diverse stakeholder which could be resolved with waterfall to get clearance on WHY before WHAT before HOW. On the other hand applying agile techniques could help convincing stakeholders to agree on already achieved results and smoothing the further requirements discussion. The project team needs to pay special attention on getting early agreement between stakeholders in place.
In technically complicated contexts it’s clear on WHY and WHAT to achieve. Still, the HOW is not clear. An agile iterative approach helps getting feedback from the project team on the achievements making adaptations possible.
Going forward in a complicated project means as well reducing it to the maximum to make the single pieces easier to understand. Technically complicated is e.g. using a specific technology for the first time. Political/social complicated is e.g. if the relation between cause and effect are not clear enough or conflicting opinions amongst various stakeholder exist.
Complex = not fully knowable but reasonably predictable, the unknown unknowns
The complexity zone stands for high risk and uncertainty and requires a high feedback frequency. Neither requirements nor the execution are clear. Holistic defined process methods don’t work any longer. The context asks for a more explorative approach with transparency, frequent inspection and adaptation. SCRUM as a process method in the toolbox of the agile mindset is the method of choice. It increases transparency with small iterations and frequent check-points allowing cheap adaptations. The team planning is the start point for each new iteration and allows immediate feedback from stakeholders to the teams to adapt the next iteration.
Complexity can not be reduced, some understanding can be achieved and complexity can not be planned, it simply grows. A good example of a complex project is software development in general. The requirements are rarely fully defined right at the beginning and it’s seldom clear which architectural solutions are superior to others.
Chaotic = neither knowable nor predictable, the unknowables
In chaotic zone requirements and execution path are both undefined and the risk is high. Kanban as the most flexible project management method is the tool of choice. With no structure like sprints and the only focus on work in progress (WIP) Kanban focuses on continuous delivering results to allow further modifications in direction and backlog items.
The goal is to move from chaotic towards complex by dividing the problems. The principle “Act, Sense and Respond” helps navigate towards the zone of complexity.
Innovation is usually part of agile product development methods. Sometimes, however, agile methods just replace other methods. SCRUM replaces Waterfall, KANBAN formalizes previously unordered work. Obviously, the innovation dilemma remains still open. Where comes the creativity from? The ideas? Where to test those hypotheses which are not part of the daily routine?
The hackathon as innovation tool
Some organizations run hackathons once or multiple times a year. We did and are doing this as well. We organized already 6 hackathons in the past. Once yearly. Did we see the innovation boost? Well, yes – and no.
How do we organize a hackathon?
A hackathon at gutefrage.net is a timeboxed activity (usually 2,5 days) and surrounded by a lot of social activities. We cook, we bake, we experience Virtual Reality, we do some board games, we play the football table and have a good time and fun. The whole company participates usually and is excited to validate hypotheses which are usually not part of the product development. There are no limits from a topic perspective. Teams organize themselves via a democratic voting exercise right at the beginning. People pitch their ideas and convince other people to become part of this specific project group.
What’s the typical outcome?
During the hackathons at gutefrage.net one out of five ideas launch during the hackathon. This one idea is production ready and creates value right from the launch. The other ideas typically proof aspects, create prototypes of various qualities, cover maximum the best-case implementation and still need an investment of 80% to be ready. The hackathon is a great team building event, it’s great for the morale, the culture. The hackathon drives people’s motivation and frustrates them if their project doesn’t make it into the finals.
What issues do we see?
The hackathon validates some hypotheses, some not and the question remains open what to do with all the started work? Will we follow some traces? Will we just abandon the work? Needless to say – after the 2,5 days hackathon there waits daily business in form of agile software development work. At gutefrage.net we promised to launch the winning idea and typically abandon the remaining work. We found that’s not the most efficient way to drive innovation.
The RocketLab – our way to innovate
As a learning organization we drew some conclusions from the hackathon experience. Mixed teams with participants from all relevant areas worked very well. The one project going live was a real push for team and company motivation. The others weren’t as good for morale. Thinking about this for a while we came up with a slightly different format – the RocketLab.
What’s different between RocketLab and the hackathon?
The RocketLab stands for outcomes and can potentially solve any topic: Product, Technology or others of cross-discipline relevance. At day one of the RocketLab there is one specific hypothesis the team focuses on. The team exclusively works for a defined period solely on solving this one issue. No distraction, just 100% focus. The team contains all disciplines to solve the issue on hand. They are all committed to create the best solution possible within the given time budget. It’s a team of maker, not talker, not theorists, no visionaries. The hackathon is broad and unspecific by nature, the RocketLab has a given goal to accomplish with the solution delegated 100% to the team.
How do we organize a RocketLab?
It’s typically either Product or Technology bringing up a specific hypothesis (or a technical complex problem to solve). A short discussion determines the amount of time we’re willing to spend on finding a solution – usually 3 to 5 days. The organizers invite people to participate in the RocketLab and the Lab kicks off. It’s never the whole company, only few people but interdisciplinary.
The initial task after kick-off is an intense planning session. The organizers introduce the hypothesis to a greater detail and the team sets goals – together with metrics. Right afterwards with a clear goal in mind and a good understanding of the metrics solution ideation starts. Ideally, the team ends this activity with a solid set of tasks for each team-member.
The RocketLab needs 100% dedicated team members – no excuses – and sits co-located in a special meeting room.
What’s the typical outcome?
The expected outcome of the RocketLab is a solution for the hypothesis from the beginning. The solution is live, up and running. If the team was not able to solve it 100% they have a clear understanding of the remaining efforts and a thorough plan. The plan is then executed in regular agile development work. One hypothesis, one implementation, one proof. The RocketLab is an efficient and effective tool to work concentratedly on a hypothesis – goal-oriented but very intense.
What issues do we see?
We did around 10 RocketLabs for very different topics. Very concrete, technical topics up to very abstract conceptual work. The results were sometimes simply spot on, other times needed further perfection during daily work. In essence, the RocketLab is a tool which borrows aspects from the hackathon but is more effective and efficient. It simply works for us and produced some very surprising solutions.
We still see some issues with the spill-over effect of the RocketLab – but that’s a minor problem. Only 20% of the Labs experienced the spill over.
Design Thinking puts one person group in focus – the user. All activities in Design Thinking circulate around making the user’s life better. Design Thinking is an activity where all stakeholder take part. Not only designers, product owners or developer are part of the group, marketing, community management, finance and even legal should be involved in this very early stage of the product development cycle. Why should they? It’s a matter of understanding and communication. All participants of the Design Thinking process are part of goal setting, reasoning and the detailed planning. They need to share the vision behind the product. Time is wisely spend in the beginning to smooth the following implementation steps. Involvement of participants? 100%. No e-mails, no meetings, just the user and their pain points.
Other names for Design Thinking are “Design Sprint” (Google) or “Iteration 0” (infoq) or “Design DOING”. Design Thinking is a great planning tool to let all people understand what is build when and with what purpose. The process consists of a set of methods typically executed directly before the typical lean and agile development cycles start. It defines what to build and to communicate this purpose amongst the participants in an efficient, effective and fun way.
What’s the result of Design Thinking?
The result of the Design Thinking activity is a verified prototype, common understanding of what to achieve and a plan on how to proceed building the Minimal Viable Product and which features to add after going live. On top of that comes the certainty to build a set of functions that user’s really want and need – not a feature an executive has fallen in love with. Further definition of Design Thinking: IDEO, interaction design foundation or wikipedia.
What’s the purpose of Design Thinking?
Customer centricity uncover real user needs
Boost communication and understanding bring business and technology together – let the whole team understand what to build and for what
Create business value create and test solutions for these user needs
Be better and faster build better products and bring them to market sooner
Be focused and measurable extract clear goals from real customer needs
Get prioritization right feature prioritization gets a lot easier (no “pet” features)
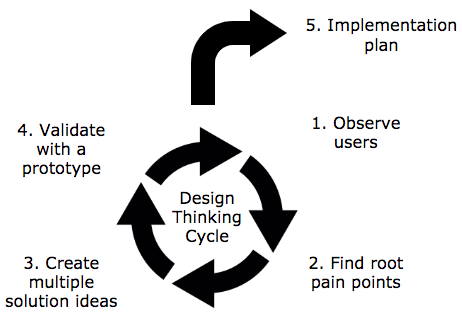
Phases of Design Thinking
Design Thinking is a fun exercise, fast paced with the goal to create a concrete problem definition and an implementation plan for the most promising solution.
5 Phases of Design Thinking
Starting with an idea of a user problem in mind the user observation phase results in a better understanding of the real user pain points. The team identifies the root pain points of the users and document them in an experience map. Creation of multiple solution ideas means to apply ideation techniques with the clear goal in mind of not implementing the first-thought-about solution. The paper prototype challenges the solution idea from ideation with the lowest possible effort and tries to resolve the user’s pain points. The implementation planning starts right after the finalization of the paper prototype. The result of the Design Thinking process is an implementation plan.
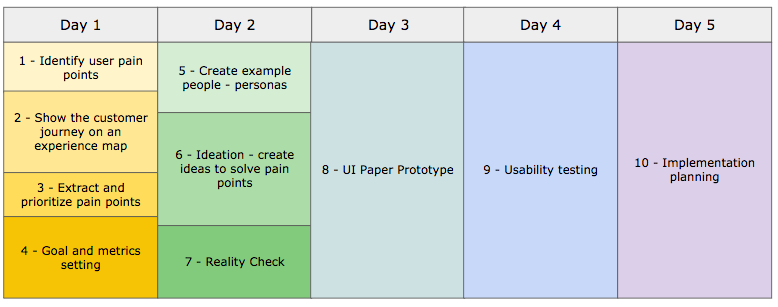
Implementation Guideline – Design Thinking in 10 Steps
1 – Identify user pain points
Go out of the building, watch, observe and interview real users experiencing the problems to solve by the solution you’re about to build. Watch at least 8 individuals! User’s verbal feedback usually contains their thinking of solutions, not their problems. The understanding of the team prior to the user observation is significantly different from it after watching and talking to users.
2 – Show the customer journey on an experience map
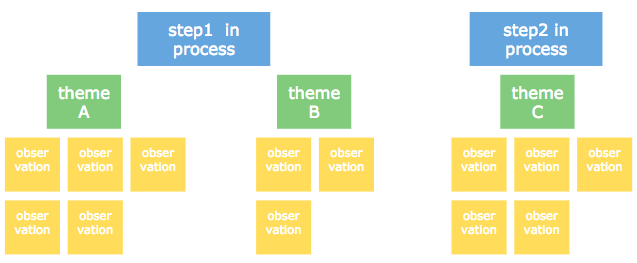
The experience map shows the current product experience (if any) and the user pain points. Organize notes from the team’s observation phase on sticky notes on a wall. All members of the Design Thinking team take part in the observation phase and make their own notes. The experience map shows the flow from the beginning (left) to the end (right) of the user journey.
Experience Map
From top to bottom the experience map shows the separate steps (above in blue) in the user journey. Below the user journey steps yellow notes represent the observations from the team members. Themes / cluster – represented in green – create an umbrella for the various observations. Additionally, emotional states – e.g. with smileys – enrich the overall journey and make it more visual.
3 – Extract and prioritize pain points
At this stage the experience map contains contains a lot of observations from various people. The next step in the process is to extract the pain points to focus on during the remainder of the process. “Dot-voting” is the tool of choice here. Each participants gets 4 to 5 dots. The biggest pain points receive the dots. Dot-voting happens all at once – at the same time. Observations may receive none, one or many dots from each participant. Counting the dots identifies the most important pain points.
4 – Goal and metrics setting
Having the ordered list of pain points extracted, the next step is to convert them into goals and make the progress measurable. Setting the goals can result in either quantitative or qualitative metrics. If possible assign real numbers to the goals. Orientation criteria for setting the goals can be:
efficiency (e.g. time spent on task)
effectiveness (e.g. reduction of # of errors)
satisfaction (customers’ happiness with the solution)
5 – Create example people – personas
Instead of developing a product for anybody – and hence most likely nobody – define real people, personas. Be specific and narrow user segments down. The persona should include the name, attributes, goals, concerns, quotes and other emotional elements. Ideally extract only 2 to 3 personas either individually or in small groups. Share the results afterwards with the rest of the group.
6 – Ideation – create ideas to solve pain points
Now it’s time to think about multiple solutions to address the user’s paint points. Don’t jump to solutions – don’t build the first “obvious” solution. Most likely there are more clever approaches available. All participants take part in the solution creation phase. Individuals create ideas time-boxed (e.g. 15 minutes). Afterwards they share them with the broader audience. There are no stupid ideas – it’s important to listen carefully to all ideas – some of them will stipulate further thinking. After the individual session a group session to detail the most promising ideas follows. Involving all team members creates shared ownership for the solution.
7 – Reality check
During ideation the goal is to create a lot of ideas. Are they all feasible? Can they really solve the issue? How does this look in reality? Since the ideas are in early stages we need to check them with reality. Place the ideas on storyboards. The storyboards show the interactions of the users with the idea. They are a sequence of scribbles which fit easily on a sheet of paper and focus on the positive user path. Let all edge cases, negative paths, recovery steps aside. Just focus on the positive user experience path associated with the idea. Reality check happens as an individual task or in smaller groups.
8 – UI Paper Prototype
The reality check sketches the user flow on a very high level – only focusing on the positive path and keeping intermediate screens aside. With the Paper Prototype the user flow should be as realistic as possible. Now the team members need to think through intermediate screens and pop-ups, edge interactions with the user and error cases as well. They transform the high-level storyboard an user interface. Sticky notes represent the UI elements – so the elements can change easily.
9 – Usability testing
Now it’s time to get real feedback from real users on the ideas developed. Any feedback is welcome and influences the prototype iterations. Feedback is usually more open since the prototype signals “Hey, we’re still in early phases. Don’t hesitate to give honest feedback!”. For the overall product changes at this stage are ways cheaper than rework done in later phases. Identify around 5 test participants – ideally based on the persona descriptions used so far in the design process. The storyboard serves as the base for tasks for the participants. The UI needs to change as an answer to the actions of the participants. Do so by exchanging notes or other elements of the UI manually. During the Paper Prototype testing give the participants no hints. The overarching goal is to identify gaps or errors in the user flow and collect feedback to improve the prototype.
10 – Implementation planning
The last step to finish the Design Thinking process is to come up with an agreed-upon implementation and launch plan. The plan is incremental in nature, delivers business value as early as possible and involves all disciplines. Implementation planning usually results in a story map which reflects the desired state of future interactions. Jeff Patton explains story maps in great detail in his book “User Story Mapping”. Here are only some important aspects.
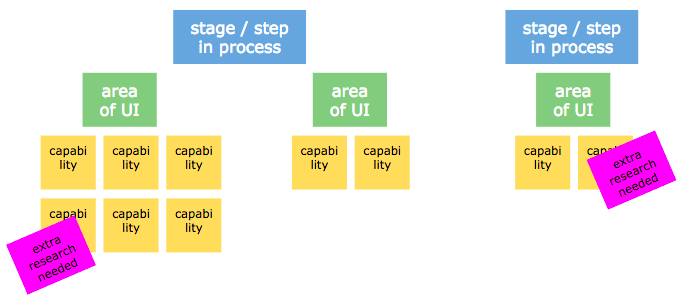
Story Map
What’s the story map?
The story map is a one page explanation of the big picture and shows details of the planned product or feature. It includes a release strategy, describes iterations around the minimum viable solution and identifies areas for additional research. First of all list all stages of the user journey as they use the product. This is usually similar or equal to the blue sticky notes produced in the experience map. Below, in green, put the concepts of the UI which help to fulfill the step in the user journey. Yellow notes hold capabilities of the product extracted from the paper prototype. Take a note on the sticky notes of the expected outcome the capability delivers to the user. The yellow notes usually translate into implementation epics in agile development. Put pink notes on capabilities marking additional research need.
With the finished story map, you have a quite comprehensive view of what needs to be build for a perfect solution. To further mitigate risk of failure you want to start with the least minimum effort in development – identify the minimum viable product feature set. Now, it’s time to sort the yellow sticky notes below the UI areas according to their criticality to the product success. Sort them into these categories having the question in mind: “How necessary for users is this capability to fulfill their task?”:
critical: absolutely necessary for user to get tasks completed
commercially acceptable: adding these features will allow commercial success
later: add capability later
nice-to-have: capability which can be added in later phases if time allows
Story Map with prioritized capabilities
When finished with the prioritization, you have your iteration planning finished. The top lane includes all capabilities needed for the minimal viable product. Next lane adds functions to enable commercial success. Later lanes store further functions to add to the product to become a full solution.
Find some videos on lynda.com by Chris Nodder on the specifics of each step and the applied technique (need a Lynda.com subscription).
Design Thinking – Timeline
Typically Design Thinking activities fit into a 5 days week. You might want to organize them like this:
Tracking of product metrics occur on various levels. PULSE and HEART stand for a logical structure of metrics to measure several aspects of your web product performance. PULSE reflects a more low-level and direct approach to performance figures. HEART on the other hand focuses on the customer experience.
Find an in-depth description of both performance frameworks in this paper from Google “Measuring the User Experience on a Large Scale: User-Centered Metrics for Web Applications” by Kerry Rodden, Hilary Hutchinson and Xin Fu. How did I came across the HEART framework? Well, I found this inspiring talk by Roan Lavery, co-founder and CPO at freeagent: “Driving Growth vs. Building Core Value” at a mindtheproduct conference in 2018. In the video he describes – amongst other aspects – how they applied the HEART framework at freeagent.
PULSE – low-level and direct
The PULSE framework focuses heavily on direct impact KPI’s to measure the performance of large-scale web products. They typically reflect technical or business aspects of the performance. PULSE stands for Page views, Uptime, Latency, Seven-day active users and Earnings.
Page views reflects the amount of users visiting your site. Uptime gives the percentage of time the server infrastructure is up, running and serving content. Latency gives a proper indication of the performance of your site infrastructure and your overall software development efforts on execution speed. Seven-day active users says a lot about retention – the ability of your site or product to motivate people to come back multiple times within 7 days. Even if seven-day active users looks like an user centric KPI it doesn’t tell anything about the level of satisfaction of your users. Earnings, finally, gives a good indication if the product works – or not.
These dimensions of a product are definitely worthwhile watching and should be observed thoroughly. But – are they good candidates to focus on user centered product development? Are they any good when it comes to value generation?
HEART – higher level and user focused
The HEART framework is less generic, it costs more work to identify the right metrics – but it helps a lot to focus on users and makes value generation the most important goal. HEART is more adjusted to the individual product, it’s less direct and needs a good understanding of the product to measure. HEART stands for Happiness, Engagement, Adoption, Retention and Task Succes.
Happiness, Engagement, Adoption, Retention and Task Success in a nutshell
Happiness is a very fluffy description of a very important state of mind of product users. If the product touches people, if it really helps it makes user more happy. A variety of KPI’s express the happiness of your users. The KPI’s are very product specific – in our case we took “Net Promoter Score”, “User Survey”, “#Bugs on the board” and “Upvote index” to measure this very qualitative dimension.
Engagement measures the level of engagement of users with your site. It’s not overall engagement with a site in general, it’s engagement with the core aspects of the site. Focus is on specific pages and sections that are critical for the value perception of the user. We track “PI per Visit”, “Engagement on QDP” (our most important page type), “User activity”.
Adoption focuses on the amount of new users discovering the product and actually decide to become active. We decided to go with “#Registrations” and “Daily Activation”.
Retention measures the amount of users coming back to the product and use the product over a period of time. We measure retention with “Stickiness 30d” and “Churn Rate”.
Task Success measures the amount of tasks completed by the users. Not any tasks – those tasks providing most value to our users. It’s important to understand how many users are really engaged with the product and perceive value from the most valuable functions of the site. We are looking at “Q&A Index” (ratio of answers and questions per user), “Time 2 Answer” and “HA Ratio” (ratio of helpful answers to all answers).
Final Thoughts
Engagement, Adoption and Retention metrics are typically measured over specific periods of time. For some products it might be worthwhile to focus on a 7-day-period others might need a 30-day-period.
We’re still fresh on HEART but I strongly believe it will change the way we develop our product in future.
Anil Cheriyan shared his thoughts on where to focus to create a fast and better working IT environment in the financial services industry – to speed up the organization (see: https://enterprisersproject.com/article/2017/6/suntrust-cios-formula-speed-relies-cloud-devops). In his post he mentioned 5 areas you should look after to break with old habits and start creating a fast pacing environment.
Anil Cheriyan is Director/Deputy Commissioner, Technology Transformation Services for the U.S. Federal Government. Previously, he was managing partner of Phase IV Ventures, a consulting and advisory firm.
Cloud
Two important aspects associated with the terminology “Cloud”. First it’s important to understand the implications of the various cloud strategies (ranging from private cloud over hybrid constructs towards public clouds). Get your strategy clear on which areas to host where. Criteria to look at are: business value provided, business continuity, resilience, security. Second aspect is the organization. Get your people involved. They need to participate in the strategy definition. They will execute them actually. No time for information hiding and bimodal IT infrastructures.
Modular architecture
Getting towards a modular architecture introduces flexibility in decisions, eliminates bottle necks and allows a decentralized governance. Today’s architectures are still monoliths or more advanced SOA stacks or somewhere in between. A more modular architecture exposes API’s via micro services. This architecture allows distributed ownership models. Complex is actually the implementation of these architecture rewrites. A lot of business related activities and the re-architecture work is a hard effort to combine.
DevOps
DevOps is finally all about the mindset of people and the break-up of silo-ed organizations. People need to learn and understand the importance of collaboration and trust. This sounds simple, turns out to be a heavy change project. Anil started pilot projects and introduced the true DevOps mindset and collaboration through success cases. It’s not about adopting rules and processes from the DevOps movement “by the books” – it’s about training your talent to work closer together.
Agile development
Agile development in software development is quite wide spread and commonly used. The acceptance over waterfall models is – where appropriate – high. Issues occur if the agile software development processes get surrounded by traditional waterfall-oriented functions – control functions. The most challenging part is to get agility into release management, deployment and integration testing.
Design thinking
Most important aspect of design thinking is the customer centricity. Understanding the real problems of the user to be solved is at the core of the approach. Not hunting the 100% perfect solution with all nice and “useful” features. Going for the most valuable solution, ship it fast. This requires heavy re-thinking within the organization. It’s more about talent and collaboration models. Important is to get people together with a thorough understanding of the industry and processes to help solving the customer’s pain points.
Ever asked yourself what you’re after eventually? Are you working being “involved” or “committed”? Are you a mercenary or a missionary? What’s your leadership style and where does it make a difference. All these questions were picked up by John Doerr (Kleiner Perkins Caufield & Byers) in April 2000 and put in relation.
In Doerr’s view there’s a fundamental difference between mediocre organizations and real value driving – great – ventures. He mentioned five dimensions to look at:
led by missionaries, not mercenaries
top-notch, passionate leadership
operation in large, rapidly growing and under-served markets
reasonable financed
working with sense of urgency
Especially the missionaries vs. mercenaries caught my attention. Marty Cagan from Silicon Valley Product Group wrote about the importance of people’s attitude in product development with a reference to missionaries vs. mercenaries (https://svpg.com/missionaries-vs-mercenaries/).
How does Doerr characterize the two M’s?
mercenary
missionary
driven by
paranoia
passion
thinking
opportunistically
strategically
going for
the sprint
the marathon
focus on
their competitors and financial statements
their customers and value statements
are
bosses of wolf packs
mentors or coaches of teams
worry
about entitlements
about making a contribution
motivation
lust for making money
desire to make a meaning
Where are you? And more important – where do you want to be?
Understanding the difference is equally important for leaders in organizations as for leaders in technology or product development.
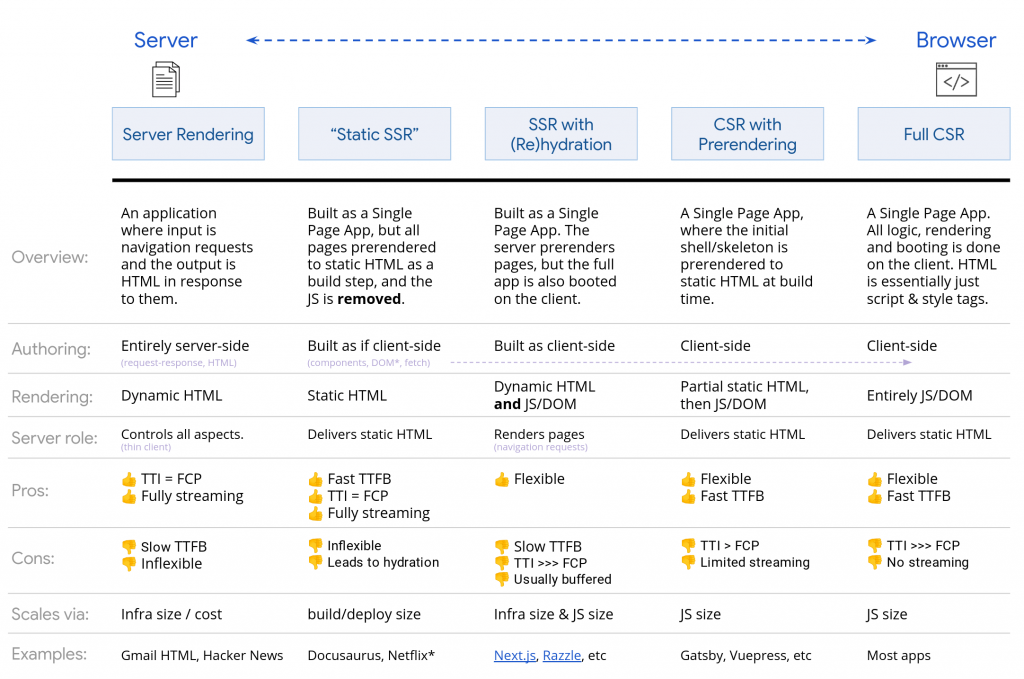
There’s a great overview of technologies available from Google comparing the different architecture options to render a web site. Jason Miller and Addy Osmani present options from SSR (server-side rendering) over various mixed models to complete CSR (client-side rendering). They describe the pros and cons of the various approaches and give hints on what to use in which situation. A great read!
SSR: Server-Side Rendering – production of HTML is done on the server
CSR: Client-Side Rendering – creation of HTML is done on the client, usually using the DOM
Rehydration: Using a JavaScript based client app to show the server-rendered HTML – mixed with the DOM tree and associated data
Prerendering: generation of HTML is done during build time
Performance acronyms
TTFB: Time to First Byte – time between clicking a link and the first bit of content
FP: First Paint – time until any pixel gets visible to the user
FCP: First Contentful Paint – time until the requested content (article, body, ..) becomes visible
TTI: Time To Interactive – time until a page becomes interactive
Jason and Addy wrap their great article up with an overview of the options. Since it’s presented under Creative Commons Attriubtion 3.0 License I decided to reproduce it here for further reference.
The internet holds quite a lot of information. Here’s my favorite collection of tools, toolboxes, methods, best practices and howto’s from various fields of application. Most of them have a tight coupling to agile software development, agile organization development, product development and cross those fields.
Following a list of links and a short description of what to find on the site.
The site contains methods and tools around product Discovery and Delivery practices. The methods are collected by the community and serve to inspire seeking minds to test them in various situations. The methods are positioned in 4 main areas: Discovery, Delivery, Options Pivot and the Foundation.
We use cookies to optimize our website and our service.
Functional
Always active
The technical storage or access is strictly necessary for the legitimate purpose of enabling the use of a specific service explicitly requested by the subscriber or user, or for the sole purpose of carrying out the transmission of a communication over an electronic communications network.
Preferences
The technical storage or access is necessary for the legitimate purpose of storing preferences that are not requested by the subscriber or user.
Statistics
The technical storage or access that is used exclusively for statistical purposes.The technical storage or access that is used exclusively for anonymous statistical purposes. Without a subpoena, voluntary compliance on the part of your Internet Service Provider, or additional records from a third party, information stored or retrieved for this purpose alone cannot usually be used to identify you.
Marketing
The technical storage or access is required to create user profiles to send advertising, or to track the user on a website or across several websites for similar marketing purposes.