Product Discovery Techniques – notes on “How to Create Tech Products Customers Love” – #10/11

Product Discovery Techniques - notes on "How to Create Tech Products Customers Love"

Product Discovery Techniques

Don’t use these discovery techniques for bug fixes or optimization. They’re meant for real product discovery work, identifying and foremost validating big new product ideas.

1) FRAMING

Framing is the activity where the problem space is defined and the relevance of the problem at hand gets better understood. Do not spend too much time in framing.

See Marty’s blog for a more thorough description: https://svpg.com/assessing-product-opportunities/.

Opportunity Assessment

The Opportunity Assessment is enough 90% of the time.

  • What business objective are you focused on?
    typically one of the OKR objectives
  • How will you know if you have succeeded?
    typically one of the OKR key results
  • What problem are you solving for our customer?
    do you really know it’s a problem?
  • Who are you solving that problem for?
    typically a target market or persona from the strategy

Internal Press Release

The Internal Press Release is not intended to go public – it’s for internal use only. The anticipated audience is new product’s customers – actually it’s the team, management and stakeholders. It’s typically 1.5 pages maximum and written in “oprah-speak”, not “geek-speak”. Sometimes, 3-4 pages of FAQ for anticipated questions are added. The structure of the internal press release looks like this: heading, summary, problem, benefits, quote from you, customer quote, closing / call to action

Amazon uses Internal Press Releases for big ideas / efforts (e.g. site redesign or moving into new country).

An alternative to the Internal Press Release is the Happy Customer Letter describing the benefits for a customer written by the customer and the CEO-letter describing benefits for the company.

Marty writes on his blog about the internal Press Release and the Customer Letter on his blog: https://svpg.com/the-customer-letter/

Lean Canvas

The Lean Canvas is ideally used for a new business unit, a business line or a startup.

Lean Canvas by LeanStack (Creative Commons Attribution-Share Alike 3.0 Un-ported License)

The canvas is described at great detail at LeanStack: https://leanstack.com/leancanvas

An alternative to the Lean Canvas is the Opportunity-Solution-Tree. It is introduced by Teresa Torres at her Mind The Product Talk 2017 in London “Critical Thinking For Product Teams“.

Marty talks about the different application areas of the Lean Canvas vs. the Opportunity Assessment on his blog: https://svpg.com/lean-canvas-vs-opportunity-assessment/.

2) PLANNING

User Story Mapping

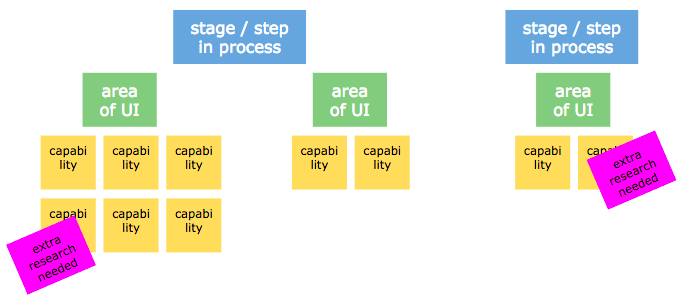
User Story Mapping helps to visualize and deconstruct the problem or solution space. It provides an holistic view and gives context. Through the collaborative process it encourages shared understanding, identifies holes in thinking and improves planning and estimates. Furthermore it heavily influences prototypes and actually helps to scope releases for the product.

More information can be found in the book „User Story Mapping“ by Jeff Patton: https://www.amazon.de/User-Story-Mapping-Discover-Product/dp/1491904909 or here “Design Thinking in a nutshell – what is it and what’s in for us?

A very good example on how workiva used User Story Mapping can be found here “Interaction Design for Enterprise Teams” by Jason Moore on Slideshare.

Customer Discovery Programs

The basic idea of the Customer Discovery Program is to discover and develop a set of reference customers in parallel with discovering and delivering the product. At the stage where the reference customer signs up for the program there is no product ready to be delivered. The Customer Discovery activity makes only sense for real big efforts, absolutely not for features. Serious enterprise customers are very likely to sign-up because they’re burned by the practices of Oracle, SAP and the likes – sell and run.

The reference customer bought the product without any side deals, runs the product in production and loves it enough to tell the world about it. In Customer Discovery, we’re looking for “Earlyvangelists”. An Earlyvangelist is best characterized by these criterion:

  • They have a problem.
  • They understand they have a problem.
  • They are actively searching for a solution.
  • They have a budget allocated.

See also the definition of the Earlyvangelist at https://steveblank.com/2010/03/04/perfection-by-subtraction-the-minimum-feature-set/.

With the Customer Discovery Program it’s simple to tell if product / market-fit is reached: achieved if 6 reference customer for a single market segment (e.g. industry, geography, …) are found. The product / market-fit product is the smallest possible product that meets the needs of this group. If you find only 4 customers or less this means the product market fit is invalidated and a pivot is needed. Work with 5-6 companies – and not more than 8. Talk to as many as possible – e.g. 50. Select only the most attractive for the Discovery Program, the other customers go into the beta program. Agree with the selected companies to be a discovery partner and ensure the right level of access to people and input. Agree with them to become a public reference if they like the delivered product.

In Enterprise business the goal is to find a single product solution that fits all discovery partners. Again, it’s important that all partners are from one single market segment. In Consumer services you should identify 8-20 Earlyvangelists and agree with them on regular phone calls to synchronize.

Examples for customer discovery: OpenTable (SMB), Symantec (Enterprise), Bazaarvoie (B2B2C), xoopit (Platform Services), Apple (internal tools), BarkBox (Consumer Service)

Marty’s blog on reference customers: https://svpg.com/the-power-of-reference-customers/

3. Ideation

Customer Interviews

Customer interviews are needed to understand your customer, to get rid of assumptions and start working with facts. Marty summarizes the value of interactions with customers in his post “Don’t talk to customers?“. Below are the key questions to answer:

  • Are your customers who you think they are?
  • Do they really have the problems you think?
  • How does the customer solve this problem now?
  • What would it take for them to switch?

Additional Ideation Techniques:

  • Concierge Test (see: https://pdmethods.com/concierge-testing/)
  • Public API’s (let others innovate on your product) – be aware of bad usage: Cambridge Analytica + Facebook
  • Hack Days (directed and undirected)
  • Data Spelunking (Hackathon on data)

4. Prototyping

The prototype should minimize the time by factor 10 to provide something to look at. See more on prototypes at Marty’s blog “Flavors of Prototypes“.

User Prototypes

User prototypes are created very fast and lightweight by nature. The prototypes are used for value testing with a consumer or customer to quickly gather feedback on both, usability and value. Low fidelity user prototypes are used for team internal iterations. Use high fidelity prototypes to show-case internally to executive people. The prototype is usually created by the Product Designer with support from the Product Manager. Ideally, when finished, the prototype could be used as a specification for the Delivery process – “prototype-as-spec”.

Paper prototypes are too limited by nature, use wireframing tools (e.g. balsamiq, axureRP, proto.io, FLINTO, UXPin, marvel, invision, Adobe XD) instead. They allow interactions with the prototype and are no more effort to build.

Feasibility Prototypes

The feasibility prototype validates the solution approach. Usually, the prototype is build by engineering to gain further insights on the implementation and test technical (e.g. scalability, performance) risks. The prototype might not be more than a code fragment or a successful validation of a 3rd party software or API integration. It may also happen that product people are not involved in the prototype at all.

Live Data Prototypes

The purpose of the live data prototype is to collect further evidence pro or contra a product decision. This prototype is more expensive to build than the user prototype, but still far less than the actual product. The prototype is not the real product, it’s usually 5-10% of the real product. It includes quantitative a/b-testing but also qualitative testing and is based on real data. A small amount of real traffic could land on the prototype to collect data. Engineering is typically needed to create the live data prototype within 2 days up to 2 weeks.

A lot of people get excited when they see the live data prototype and tend to confuse the prototype with the real product. But there’s still a significant difference between production ready software and the live data prototype. The real product needs:

  • All required use cases
  • Instrumentation / analytics
  • Test automation
  • Scale and performance
  • SEO work
  • Maintainability
  • Internationalization / localization

A good example of a live data prototype is Amazon’s “Frequently bought together” feature. The idea of building the features was rejected by SVP Marketing. So, strong evidence was needed because it was simply too expensive and risky to productize the feature without further evidence. So, the team decided to build a live data prototype with a small amount of real traffic in a specific product category. The prototype was a/b-tested and the collected data provided a significant uplift in business KPI’s. This is a great example of a high-integrity business case.

Hybrid Prototypes

Hybrid prototypes mix those elements needed to tackle the specific risks at hand. They blend various techniques and are mainly limited by your own creativity.

A good example of an hybrid prototype is Zappos. Zappos solved the problem of female shoppers to buy fashion shoes online. They defined and understood their personas and their key problems with shopping online: 1) returning goods 2) no timely delivery 3) not knowing the size 4) bad product images. Zappos prototyped a potential solution to the persona’s problems by mixing a variety of prototypes: user prototype (appealing front-end), live data prototype (product catalogue and images) and the “Wizard of Oz” (buying the shoes at the shop over the street and delivering to customer). Most important was: the users shouldn’t recognize the prototype character of the solution. Zappos controlled the amount of traffic via AdWords and made sure they could handle the manual part. So, with this mixture of prototypes – that for sure doesn’t scale – they could validate demand, value and usability.

Testing Product Ideas

“Prototype as if you know you’re right, but test as if you know you’re wrong.”

d.school

Marty writes in his blog about “Prototype Testing” more detailed on the various ways to testing.

5. Testing Usability

Usability testing includes interacting with customers, getting their feedback. For the test session, have the prototype ready – up and running and focus on the prepared questions to understand if users have issues using your product. The session may be conducted at your office, the customer’s office or at a mutual convenient location (e.g. Starbucks) or – if not possible – remote via video conference.

Recruiting users in B2B context is done via the customer discovery program, in B2C via AdWords. AdWords allow acquisition of users based on keywords and / or geo-targeting. It’s the most cost-effective solution and easy to stop and restart again. Payment is entirely based on performance.

6. Testing Value

Testing value focuses on three aspects: testing demand (is this really a problem?), testing efficacy (how well does the product solve the problem?) and testing response (how excited are the testers?).

Testing Demand

Testing demand answers the question if people are willing to use the product, if they understand the value and see the product solving a real problem they have. Marty talks more about Desirability Testing on his blog about “Product Validation“. Some techniques for demand testing are described below

Fake Door Test

A fake door test fakes a product feature for the customer. If the customer acts with the fake product a thank-you-message is displayed and sometimes contact information is collected. Furthermore, nothing happens. The goal of the test is to collect data, to measure the click-thru ratio. More information on the fake door test can be found here: http://learningloop.io/plays/fake-door-testing.

Landing Page Test

A landing page test pitches product features, products, product lines or other promises to the customer combined with an explicit call to action. Push traffic on the landing page via e.g. AdWords or other comparable methods. Now, measure the conversion – how many people do actually interact with the landing page and are interested enough to follow the call to action? With the click, nothing happens with the customer other than a friendly thank you message and sometimes the question for contact details. More information on the landing page test can be found here: http://learningloop.io/plays/spoof-landing-pages

Explainer Video

The explainer video shows a high fidelity prototype at work. It’s basically a video of a product demo. It is then distributed and measured like the landing page test above. The goal, again, is to measure demand for the demoed product. More on the explainer video: http://learningloop.io/plays/video-demo

Kickstarter Testing

A great way to test a product idea without jeopardizing your brand is to test demand on kickstarter.com. Just place the product idea at the crowdfunding platform as a “nobody”. If the idea creates enough buzz it’s worthwhile a further investment, if not it can be dropped silently without creating any noise. Read more on the idea from Mark Dwight “How to Kickstart Your Market – Why even established companies can use crowdfunding.

Qualitative Value Testing

“Find everything that’s wrong with the product and fix it; Seek negative feedback.”

Elon Musk

Qualitative testing explains why it’s working or not, it gives insight why something is happening or isn’t. It doesn’t try to prove anything. You won’t get the answer from any one user test; every single test provides another piece of the puzzle. It’s important to test with real users and customers to judge the value.

Qualitative value testing is done with prototypes or the real product. It provides insights from usability and value perspective. On top it usually provides unexpected insights from the customer. It’s typically done fast and cheap. To really understand how much customers value the product, various questions or tests can be conducted:

  • Payment – will they pay for it?
    credit card information, pre-order form, letter of intent (in B2B)
  • Reputation – will they recommend it?
    NPS, introduction to peers or the boss, public reference
  • Time – will they meet again? Will they invest their time?
    agreement on follow-up meeting, non-trivial trial
  • Behavior – will they switch from their current solution?

Quantitative Value Testing

“Features are not inherently valuable. The value for our customers is only realized when a feature fulfills a need. It’s only realized for our business when we see the results of our work move the needle. That’s why we need to concentrate on the outcomes over the outputs.”

Melissa Perri (see: https://melissaperri.com/)

Quantitative value testing can provide evidence or even proof that something truly works – or isn’t. It generally can not explain why it’s so. It’s done to get a clearer picture on the impact on your revenue, your brand, your customers and also your employees.

Quantitative testing can be done with the existing product – or a live-data prototype – in an A/B testing setup on a certain amount of your traffic. Alternatively, it could be done with a limited amount of your customer through invitation. In a B2B scenario, you’d use your existing customer relation via the Customer Discovery Program to get exposure of the test to people.

A good example for a quantitative value test is Spotify’s “Discover Weekly” feature. Data collected in an A/B test was compelling enough to fully implement the feature. The launch-ready implementation included some big hurdles and a lot of effort on the data crunching side. So, it was well worth the effort to test – before – putting the feature in Delivery.

7. Testing Feasibility

Testing feasibility mainly addresses technical concerns – are we able to build this at all? To test feasibility it’s important to create prototypes that focus on the key areas of concern. Emphasize speed of learning over reuse of the written code. Your Tech people need to answer these questions:

  • Do we know how to build this?
  • Do we have the skills on the team?
  • Do we have enough time?
  • Do we have the right architecture or components?
  • Do we understand the dependencies?
  • Will the performance and scale meet our needs?
  • Do we have the infrastructure to test and run this?

8. Testing Business Viability

Business viability – does this feature / product fit with our business? – needs to be addressed to be successful within the own organization. Your stakeholders (e.g. Senior Executives, Sales, Marketing, Finance, Legal, Security, Business Operations, …) need to be informed regularly, you need to earn their trust. Have discussions with them and make them feel you understand them – but remember: everyone has a voice, but not a vote! Try to engage individually with them, group meetings can cause a lot of damage and are harder to handle. When talking to your stakeholder, have your data ready – data always beats opinions. And read the signs during the meeting – differentiate between stop signs and yield signs.

Techniques you can use for a stakeholder meeting is typically a high fidelity user prototype and / or a product walkthrough.

This blog post is part of a series. It summarizes my personal notes of the workshop held by Marty Cagan “How to Create Tech Products Customers Love” from 5th to 6th of June in 2019 in San Francisco.

Product Culture & Transformation – notes on “How to Create Tech Products Customers Love” – #11/11

Product Culture & Transformation - notes on "How to Create Tech Products Customers Love"

Product Culture & Transformation

Transformation Techniques

One transformation technique Marty recommends is the Discovery Sprint. He recommends to do a Discovery Sprint when a team struggles to learn how to do product discovery, when the team has something big and critically important to solve or if the team is just moving too slowly. Marty talks more about it on his blog https://svpg.com/discovery-sprints/ and refers to the Book “Sprint” by Jake Knapp et al.

Another is named Pilot Teams. The idea behind the Pilot Teams is to create success within a smaller protected environment and convince doubtful or fearful or lazy people to follow the change process. The principle is borrowed from the technology adoption curve (aka “Gartner Hype Cycle”) – some people are early adopters, others are less eager. Chris Jones from SVPG talks about this technique in “Pilot Teams“. With these pilot teams the idea of A/B testing – well known from product development – can be applied to organization development as well.

Outcome-based Roadmaps is yet another way to start the transformation process. Simply continue working with product roadmaps, however introduce two differences. First, annotate every roadmap item with its associated expected business result. Every time this item is discussed highlight the expected business result. Second, after the launch of an roadmap item report immediately the actual result vs. the expected result. So, during the next 3-12 month the opportunity assessment information will get its way into the roadmap. For prioritization try to move away from prioritizing ideas to problems.

Common Product Discovery Pitfalls

Marty mentions several pitfalls he experienced and saw teams struggle with. He talks a lot more in his blog post on “Product Discovery: Pitfalls and Anti-Patterns“. Here’s just a summary and some notes.

  • Confirmation-biased Discovery
    The team and / or the stakeholders are not really interested in the results of Discovery, they just need affirmation.
  • Product as Prototype Discovery
    The team pretends working on a prototype implementation but it takes too long to actually get the prototype shipped (e.g. 4 month).
  • Partial Team Discovery
    Not Technology, UX and Product go see the customer, it’s only Product + UX.
  • One-Dimensional Discovery
    The team focusses only on quantitative or qualitative validation and draws wrong or incomplete conclusions.
  • Big Bang Discovery
    The team works on a single, big release shipped within a lengthy time frame. They don’t work in an iterative mode.
  • Outsourced Discovery
    The organization / stakeholders hired a “creative” agency to do the creative Discovery work. The implementation should then be picked up by the team.

Culture Baseline of successful companies

“If we get the culture right, most of the other stuff will happen naturally on its own.”

Tony Hiseh, CEO Zappos
  1. Tackle Risks up Front
    • Value Risk – will they use / buy it?
    • Usability Risk – can they us it?
    • Feasibility Risk – can we build it?
    • Business Viability Risk – will our stakeholders support it?
  2. Define Products Collaboratively, not Sequentially
    • Product Management
    • Product Design
    • Engineering
  3. Focus on Business Results, not Output
    • Product teams exists to solve problems in ways that your customers love, yet work for your business.

This blog post is part of a series. It summarizes my personal notes of the workshop held by Marty Cagan “How to Create Tech Products Customers Love” from 5th to 6th of June in 2019 in San Francisco.

Innovation and organizations – Hackathon vs. RocketLab

Innovation is usually part of agile product development methods. Sometimes, however, agile methods just replace other methods. SCRUM replaces Waterfall, KANBAN formalizes previously unordered work. Obviously, the innovation dilemma remains still open. Where comes the creativity from? The ideas? Where to test those hypotheses which are not part of the daily routine?

The hackathon as innovation tool

Some organizations run hackathons once or multiple times a year. We did and are doing this as well. We organized already 6 hackathons in the past. Once yearly. Did we see the innovation boost? Well, yes – and no.

How do we organize a hackathon?

A hackathon at gutefrage.net is a timeboxed activity (usually 2,5 days) and surrounded by a lot of social activities. We cook, we bake, we experience Virtual Reality, we do some board games, we play the football table and have a good time and fun. The whole company participates usually and is excited to validate hypotheses which are usually not part of the product development. There are no limits from a topic perspective. Teams organize themselves via a democratic voting exercise right at the beginning. People pitch their ideas and convince other people to become part of this specific project group.

What’s the typical outcome?

During the hackathons at gutefrage.net one out of five ideas launch during the hackathon. This one idea is production ready and creates value right from the launch. The other ideas typically proof aspects, create prototypes of various qualities, cover maximum the best-case implementation and still need an investment of 80% to be ready. The hackathon is a great team building event, it’s great for the morale, the culture. The hackathon drives people’s motivation and frustrates them if their project doesn’t make it into the finals.

What issues do we see?

The hackathon validates some hypotheses, some not and the question remains open what to do with all the started work? Will we follow some traces? Will we just abandon the work? Needless to say – after the 2,5 days hackathon there waits daily business in form of agile software development work. At gutefrage.net we promised to launch the winning idea and typically abandon the remaining work. We found that’s not the most efficient way to drive innovation.


The RocketLab – our way to innovate

As a learning organization we drew some conclusions from the hackathon experience. Mixed teams with participants from all relevant areas worked very well. The one project going live was a real push for team and company motivation. The others weren’t as good for morale. Thinking about this for a while we came up with a slightly different format – the RocketLab.

What’s different between RocketLab and the hackathon?

The RocketLab stands for outcomes and can potentially solve any topic: Product, Technology or others of cross-discipline relevance. At day one of the RocketLab there is one specific hypothesis the team focuses on. The team exclusively works for a defined period solely on solving this one issue. No distraction, just 100% focus. The team contains all disciplines to solve the issue on hand. They are all committed to create the best solution possible within the given time budget. It’s a team of maker, not talker, not theorists, no visionaries. The hackathon is broad and unspecific by nature, the RocketLab has a given goal to accomplish with the solution delegated 100% to the team.

How do we organize a RocketLab?

It’s typically either Product or Technology bringing up a specific hypothesis (or a technical complex problem to solve). A short discussion determines the amount of time we’re willing to spend on finding a solution – usually 3 to 5 days. The organizers invite people to participate in the RocketLab and the Lab kicks off. It’s never the whole company, only few people but interdisciplinary.

The initial task after kick-off is an intense planning session. The organizers introduce the hypothesis to a greater detail and the team sets goals – together with metrics. Right afterwards with a clear goal in mind and a good understanding of the metrics solution ideation starts. Ideally, the team ends this activity with a solid set of tasks for each team-member.

The RocketLab needs 100% dedicated team members – no excuses – and sits co-located in a special meeting room.

What’s the typical outcome?

The expected outcome of the RocketLab is a solution for the hypothesis from the beginning. The solution is live, up and running. If the team was not able to solve it 100% they have a clear understanding of the remaining efforts and a thorough plan. The plan is then executed in regular agile development work. One hypothesis, one implementation, one proof. The RocketLab is an efficient and effective tool to work concentratedly on a hypothesis – goal-oriented but very intense.

What issues do we see?

We did around 10 RocketLabs for very different topics. Very concrete, technical topics up to very abstract conceptual work. The results were sometimes simply spot on, other times needed further perfection during daily work. In essence, the RocketLab is a tool which borrows aspects from the hackathon but is more effective and efficient. It simply works for us and produced some very surprising solutions.

We still see some issues with the spill-over effect of the RocketLab – but that’s a minor problem. Only 20% of the Labs experienced the spill over.

graphics
rocket – used under creative commons license (CC BY 4.0), non-modified
hackathon logo “The Hacking Dead”: © by gutefrage.net

Design Thinking in a nutshell – what is it and what’s in for us?

What is Design Thinking?

Design Thinking puts one person group in focus – the user. All activities in Design Thinking circulate around making the user’s life better. Design Thinking is an activity where all stakeholder take part. Not only designers, product owners or developer are part of the group, marketing, community management, finance and even legal should be involved in this very early stage of the product development cycle. Why should they? It’s a matter of understanding and communication. All participants of the Design Thinking process are part of goal setting, reasoning and the detailed planning. They need to share the vision behind the product. Time is wisely spend in the beginning to smooth the following implementation steps. Involvement of participants? 100%. No e-mails, no meetings, just the user and their pain points.

Other names for Design Thinking are “Design Sprint” (Google) or “Iteration 0” (infoq) or “Design DOING”. Design Thinking is a great planning tool to let all people understand what is build when and with what purpose. The process consists of a set of methods typically executed directly before the typical lean and agile development cycles start. It defines what to build and to communicate this purpose amongst the participants in an efficient, effective and fun way.

What’s the result of Design Thinking?

The result of the Design Thinking activity is a verified prototype, common understanding of what to achieve and a plan on how to proceed building the Minimal Viable Product and which features to add after going live. On top of that comes the certainty to build a set of functions that user’s really want and need – not a feature an executive has fallen in love with. Further definition of Design Thinking: IDEO, interaction design foundation or wikipedia.

What’s the purpose of Design Thinking?

  • Customer centricity uncover real user needs
  • Boost communication and understanding bring business and technology together – let the whole team understand what to build and for what
  • Create business value create and test solutions for these user needs
  • Be better and faster build better products and bring them to market sooner
  • Be focused and measurable extract clear goals from real customer needs
  • Get prioritization right feature prioritization gets a lot easier (no “pet” features)

Phases of Design Thinking

Design Thinking is a fun exercise, fast paced with the goal to create a concrete problem definition and an implementation plan for the most promising solution.

5 Phases of Design Thinking

Starting with an idea of a user problem in mind the user observation phase results in a better understanding of the real user pain points. The team identifies the root pain points of the users and document them in an experience map. Creation of multiple solution ideas means to apply ideation techniques with the clear goal in mind of not implementing the first-thought-about solution. The paper prototype challenges the solution idea from ideation with the lowest possible effort and tries to resolve the user’s pain points. The implementation planning starts right after the finalization of the paper prototype. The result of the Design Thinking process is an implementation plan.

Implementation Guideline – Design Thinking in 10 Steps

1 – Identify user pain points

Go out of the building, watch, observe and interview real users experiencing the problems to solve by the solution you’re about to build. Watch at least 8 individuals! User’s verbal feedback usually contains their thinking of solutions, not their problems. The understanding of the team prior to the user observation is significantly different from it after watching and talking to users.

2 – Show the customer journey on an experience map

The experience map shows the current product experience (if any) and the user pain points. Organize notes from the team’s observation phase on sticky notes on a wall. All members of the Design Thinking team take part in the observation phase and make their own notes. The experience map shows the flow from the beginning (left) to the end (right) of the user journey.

Experience Map

From top to bottom the experience map shows the separate steps (above in blue) in the user journey. Below the user journey steps yellow notes represent the observations from the team members. Themes / cluster – represented in green – create an umbrella for the various observations. Additionally, emotional states – e.g. with smileys – enrich the overall journey and make it more visual.

3 – Extract and prioritize pain points

At this stage the experience map contains contains a lot of observations from various people. The next step in the process is to extract the pain points to focus on during the remainder of the process. “Dot-voting” is the tool of choice here. Each participants gets 4 to 5 dots. The biggest pain points receive the dots. Dot-voting happens all at once – at the same time. Observations may receive none, one or many dots from each participant. Counting the dots identifies the most important pain points.

4 – Goal and metrics setting

Having the ordered list of pain points extracted, the next step is to convert them into goals and make the progress measurable. Setting the goals can result in either quantitative or qualitative metrics. If possible assign real numbers to the goals. Orientation criteria for setting the goals can be:

  • efficiency (e.g. time spent on task)
  • effectiveness (e.g. reduction of # of errors)
  • satisfaction (customers’ happiness with the solution)

5 – Create example people – personas

Instead of developing a product for anybody – and hence most likely nobody – define real people, personas. Be specific and narrow user segments down. The persona should include the name, attributes, goals, concerns, quotes and other emotional elements. Ideally extract only 2 to 3 personas either individually or in small groups. Share the results afterwards with the rest of the group.

6 – Ideation – create ideas to solve pain points

Now it’s time to think about multiple solutions to address the user’s paint points. Don’t jump to solutions – don’t build the first “obvious” solution. Most likely there are more clever approaches available. All participants take part in the solution creation phase. Individuals create ideas time-boxed (e.g. 15 minutes). Afterwards they share them with the broader audience. There are no stupid ideas – it’s important to listen carefully to all ideas – some of them will stipulate further thinking. After the individual session a group session to detail the most promising ideas follows. Involving all team members creates shared ownership for the solution.

7 – Reality check

During ideation the goal is to create a lot of ideas. Are they all feasible? Can they really solve the issue? How does this look in reality? Since the ideas are in early stages we need to check them with reality. Place the ideas on storyboards. The storyboards show the interactions of the users with the idea. They are a sequence of scribbles which fit easily on a sheet of paper and focus on the positive user path. Let all edge cases, negative paths, recovery steps aside. Just focus on the positive user experience path associated with the idea. Reality check happens as an individual task or in smaller groups.

8 – UI Paper Prototype

The reality check sketches the user flow on a very high level – only focusing on the positive path and keeping intermediate screens aside. With the Paper Prototype the user flow should be as realistic as possible. Now the team members need to think through intermediate screens and pop-ups, edge interactions with the user and error cases as well. They transform the high-level storyboard an user interface. Sticky notes represent the UI elements – so the elements can change easily.

9 – Usability testing

Now it’s time to get real feedback from real users on the ideas developed. Any feedback is welcome and influences the prototype iterations. Feedback is usually more open since the prototype signals “Hey, we’re still in early phases. Don’t hesitate to give honest feedback!”. For the overall product changes at this stage are ways cheaper than rework done in later phases. Identify around 5 test participants – ideally based on the persona descriptions used so far in the design process. The storyboard serves as the base for tasks for the participants. The UI needs to change as an answer to the actions of the participants. Do so by exchanging notes or other elements of the UI manually. During the Paper Prototype testing give the participants no hints. The overarching goal is to identify gaps or errors in the user flow and collect feedback to improve the prototype.

10 – Implementation planning

The last step to finish the Design Thinking process is to come up with an agreed-upon implementation and launch plan. The plan is incremental in nature, delivers business value as early as possible and involves all disciplines. Implementation planning usually results in a story map which reflects the desired state of future interactions. Jeff Patton explains story maps in great detail in his book “User Story Mapping”. Here are only some important aspects.

Story Map

What’s the story map?

The story map is a one page explanation of the big picture and shows details of the planned product or feature. It includes a release strategy, describes iterations around the minimum viable solution and identifies areas for additional research. First of all list all stages of the user journey as they use the product. This is usually similar or equal to the blue sticky notes produced in the experience map. Below, in green, put the concepts of the UI which help to fulfill the step in the user journey. Yellow notes hold capabilities of the product extracted from the paper prototype. Take a note on the sticky notes of the expected outcome the capability delivers to the user. The yellow notes usually translate into implementation epics in agile development. Put pink notes on capabilities marking additional research need.

With the finished story map, you have a quite comprehensive view of what needs to be build for a perfect solution. To further mitigate risk of failure you want to start with the least minimum effort in development – identify the minimum viable product feature set. Now, it’s time to sort the yellow sticky notes below the UI areas according to their criticality to the product success. Sort them into these categories having the question in mind: “How necessary for users is this capability to fulfill their task?”:

  • critical: absolutely necessary for user to get tasks completed
  • commercially acceptable: adding these features will allow commercial success
  • later: add capability later
  • nice-to-have: capability which can be added in later phases if time allows
Story Map with prioritized capabilities

When finished with the prioritization, you have your iteration planning finished. The top lane includes all capabilities needed for the minimal viable product. Next lane adds functions to enable commercial success. Later lanes store further functions to add to the product to become a full solution.

Find some videos on lynda.com by Chris Nodder on the specifics of each step and the applied technique (need a Lynda.com subscription).

Design Thinking – Timeline

Typically Design Thinking activities fit into a 5 days week. You might want to organize them like this:

Design Thinking – week template

Measuring your product performance – PULSE vs. HEART

PULSE vs. HEART – an overview

Tracking of product metrics occur on various levels. PULSE and HEART stand for a logical structure of metrics to measure several aspects of your web product performance. PULSE reflects a more low-level and direct approach to performance figures. HEART on the other hand focuses on the customer experience.

Find an in-depth description of both performance frameworks in this paper from Google “Measuring the User Experience on a Large Scale: User-Centered Metrics for Web Applications” by Kerry Rodden, Hilary Hutchinson and Xin Fu.  How did I came across the HEART framework? Well, I found this inspiring talk by Roan Lavery, co-founder and CPO at freeagent: “Driving Growth vs. Building Core Value” at a mindtheproduct conference in 2018. In the video he describes – amongst other aspects – how they applied the HEART framework at freeagent.

PULSE – low-level and direct

The PULSE framework focuses heavily on direct impact KPI’s to measure the performance of large-scale web products. They typically reflect technical or business aspects of the performance. PULSE stands for Page views, Uptime, Latency, Seven-day active users and Earnings. 

Page views reflects the amount of users visiting your site. Uptime gives the percentage of time the server infrastructure is up, running and serving content. Latency gives a proper indication of the performance of your site infrastructure and your overall software development efforts on execution speed. Seven-day active users says a lot about retention – the ability of your site or product to motivate people to come back multiple times within 7 days. Even if seven-day active users looks like an user centric KPI it doesn’t tell anything about the level of satisfaction of your users. Earnings, finally, gives a good indication if the product works – or not.

These dimensions of a product are definitely worthwhile watching and should be observed thoroughly. But – are they good candidates to focus on user centered product development? Are they any good when it comes to value generation?  

HEART – higher level and user focused

The HEART framework is less generic, it costs more work to identify the right metrics – but it helps a lot to focus on users and makes value generation the most important goal. HEART is more adjusted to the individual product, it’s less direct and needs a good understanding of the product to measure. HEART stands for Happiness, Engagement, Adoption, Retention and Task Succes. 

Happiness, Engagement, Adoption, Retention and Task Success in a nutshell

Happiness is a very fluffy description of a very important state of mind of product users. If the product touches people, if it really helps it makes user more happy. A variety of KPI’s express the happiness of your users. The KPI’s are very product specific – in our case we took “Net Promoter Score”, “User Survey”, “#Bugs on the board” and “Upvote index” to measure this very qualitative dimension.

Engagement measures the level of engagement of users with your site. It’s not overall engagement with a site in general, it’s engagement with the core aspects of the site. Focus is on specific pages and sections that are critical for the value perception of the user. We track “PI per Visit”, “Engagement on QDP” (our most important page type), “User activity”.  

Adoption focuses on the amount of new users discovering the product and actually decide to become active. We decided to go with “#Registrations” and “Daily Activation”.

Retention measures the amount of users coming back to the product and use the product over a period of time. We measure retention with “Stickiness 30d” and “Churn Rate”.

Task Success measures the amount of tasks completed by the users. Not any tasks – those tasks providing most value to our users. It’s important to understand how many users are really engaged with the product and perceive value from the most valuable functions of the site. We are looking at “Q&A Index” (ratio of answers and questions per user), “Time 2 Answer” and “HA Ratio” (ratio of helpful answers to all answers).

Final Thoughts

Engagement, Adoption and Retention metrics are typically measured over specific periods of time. For some products it might be worthwhile to focus on a 7-day-period others might need a 30-day-period.

We’re still fresh on HEART but I strongly believe it will change the way we develop our product in future. 

Are you a mercenary or a missionary leader?

Ever asked yourself what you’re after eventually? Are you working being “involved” or “committed”? Are you a mercenary or a missionary? What’s your leadership style and where does it make a difference. All these questions were picked up by John Doerr (Kleiner Perkins Caufield & Byers) in April 2000 and put in relation.

A great article to read: http://knowledge.wharton.upenn.edu/article/mercenaries-vs-missionaries-john-doerr-sees-two-kinds-of-internet-entrepreneurs/

In Doerr’s view there’s a fundamental difference between mediocre organizations and real value driving – great – ventures. He mentioned five dimensions to look at:

  1. led by missionaries, not mercenaries
  2. top-notch, passionate leadership
  3. operation in large, rapidly growing and under-served markets
  4. reasonable financed
  5. working with sense of urgency

Especially the missionaries vs. mercenaries caught my attention. Marty Cagan from Silicon Valley Product Group wrote about the importance of people’s attitude in product development with a reference to missionaries vs. mercenaries (https://svpg.com/missionaries-vs-mercenaries/).

How does Doerr characterize the two M’s?

mercenarymissionary
driven byparanoiapassion
thinkingopportunisticallystrategically
going forthe sprintthe marathon
focus ontheir competitors and
financial statements
their customers and
value statements
arebosses of wolf packsmentors or coaches of teams
worryabout entitlementsabout making a contribution
motivationlust for making moneydesire to make a meaning

Where are you? And more important – where do you want to be?

Understanding the difference is equally important for leaders in organizations as for leaders in technology or product development.

Toolbox, Best Practice, Tools, HowTo’s – agile practices and how to apply them

The internet holds quite a lot of information. Here’s my favorite collection of tools, toolboxes, methods, best practices and howto’s from various fields of application. Most of them have a tight coupling to agile software development, agile organization development, product development and cross those fields.

Following a list of links and a short description of what to find on the site.

Open Practice Library, https://openpracticelibrary.com/

The site contains methods and tools around product Discovery and Delivery practices. The methods are collected by the community and serve to inspire seeking minds to test them in various situations. The methods are positioned in 4 main areas: Discovery, Delivery, Options Pivot and the Foundation.

Discovery contains methods like:

Options Pivot holds tools like:

Delivery contains these tools:

Foundation hold something like these:

Ideo – Design Kit, http://www.designkit.org/methods

This is a collection of tools around Inspiration, Ideation and Implementation. The kit is provided by IDEO.org.

Inspiration

Ideation

Implementation

Other Tool Sets